Presentations are an integral part of any organizational structure especially when it comes to evaluating a certain strategy, working on a new project or for that matter any avenue that calls for an audience centric, engaging, and informative seminar/speech.
The most difficult to make graphics used in presentations are curves. Out of all the curves used in the modern world of presentations the J-curve holds a position of importance. Generally used to represent a situation of gradual fall and then a steep rise in any situation the J curve as the name suggests is plotted in the shape of the English alphabet “J”, with reference to the co-ordinate axes.

The J-curve is of extreme importance in the following situations and can easily be plotted using associated templates.
Fiscal Curves
Representing a Fiscal situation against the parameter of time can easily be done using the J-curve. In case where the fiscal parameter saw a gradual drop in the initial phase from a set value and then gained value in a short period of time the J-curve is the perfect way to represent the data.
Reaction Rates For Chemical Reactions
For any chemical reaction the conditions surrounding the reaction play a vital role in the rate at which the reaction proceeds, apart from other factors like concentration of the reactants and the energy conditions. For most reactions the energy curve can easily be represented using the J-curve.
General Economics
The consumption of goods and services, variation in rates of interest, equity values, and a number of other situations are usually represented using J-curve based graphs.
How To Easily Create A J-Curve Using PowerPoint Templates
Apart from the above situations J-curves are used in a vivid number of situations and are one of the most used curves especially when it comes to power point presentations. There are a number of templates available that make plotting J-curves a piece of cake. Making use of these J-curve templates take presentation making to a whole new level and provides them an added edge over others while making the slides better looking.
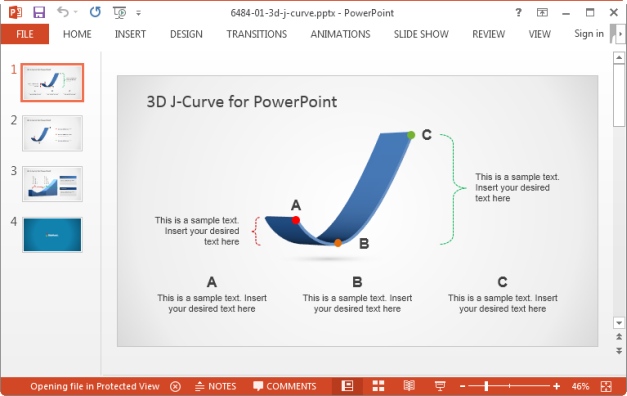
The 3D J-Curve Template for PowerPoint is a template which comes with an editable 3D J-Curve diagram which can be edited for making custom J Curves.
Go to Download 3D J-Curve Template for PowerPoint
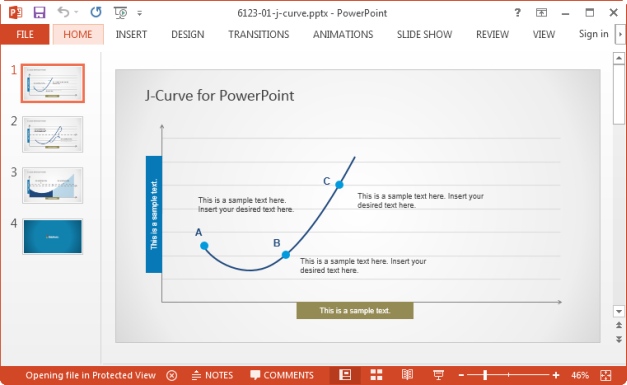
If you are looking for a simple template, you can use this simple J-Curve Template for PowerPoint to create basic J-Curve diagrams. Both these templates are easy to customize and you can move various diagram objects via drag and drop, as well as recolor and resize slide elements.


