Free Root Cause Analysis Template for PowerPoint
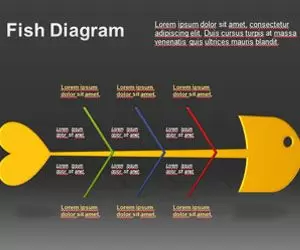
A three-tier structured Root Cause Analysis slide template for PowerPoint presentations, with fishbone diagram, enables in-depth root-cause analysis with visual impact.
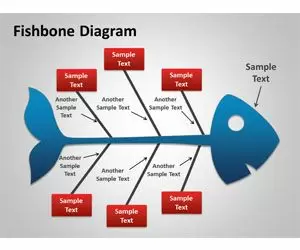
Find free fishbone diagram templates for PowerPoint. Under this section you can download editable fishbone diagrams. Fishbone diagrams are useful to describe the cause & effect analysis. Fishbone PowerPoint template designs under this category are 100% editable and can help you to prepare compelling cause & effect slides for your presentations.

A three-tier structured Root Cause Analysis slide template for PowerPoint presentations, with fishbone diagram, enables in-depth root-cause analysis with visual impact.
A free fishbone diagram template for PowerPoint to present cause-and-effect analysis, identify factors causing specific events, aiding product design and quality.
The fishbone diagram is a type of visual representation that helps in brainstorming to identify the possible causes & effects of a problem or situation. It is often called “fishbone diagram” or Ishikawa diagrams (as the visualization was created by Kaoru Ishikawa).
Common uses of Fishbone diagrams are often found in product design and quality defect prevention. In these cases, the fishbone diagram is used to identify potential factors causing an overall effect.
However, Fishbone diagrams are widely used in other industries and for other purposes. For example, in problem analysis and business presentations to help presenting a cause & effect analysis. Applications and examples of Fishbone diagrams can be found online.
The “measurement” is a component that belongs to the 6Ms of production, including Manpower, Method, Machine, Material, Milieu and Measurement. The 6M mnemonic represents the characteristic dimensions to consider when brainstorming a “cause and effect” problem-solving sessions.