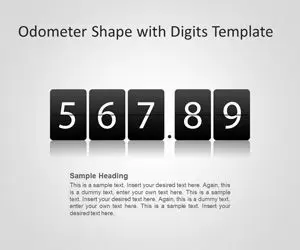
Free Odometer Shape PowerPoint template with digits is a free template for PowerPoint presentations that let you prepare awesome presentations with odometer digits. You can download free odometer PowerPoint template to make presentation dashboards using Microsoft PowerPoint or other presentations with countdown and numbers. Odometer PPT template for Microsoft PowerPoint is an awesome presentation template with digits for analog and digital presentations. Free odometer digits template for PowerPoint is compatible with major versions of Microsoft PowerPoint 2010 and 2013.
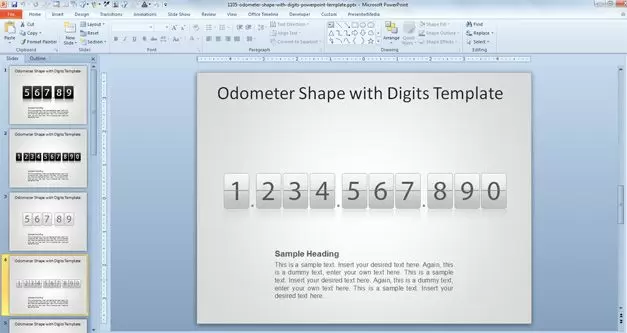
Free Odometer template for PowerPoint presentations contains four unique slide designs with editable digits for PowerPoint presentations that you can edit to compose any number. In this PowerPoint template you can copy and duplicate digits to compose any desired number and you have assets like dots and white or dark digits.
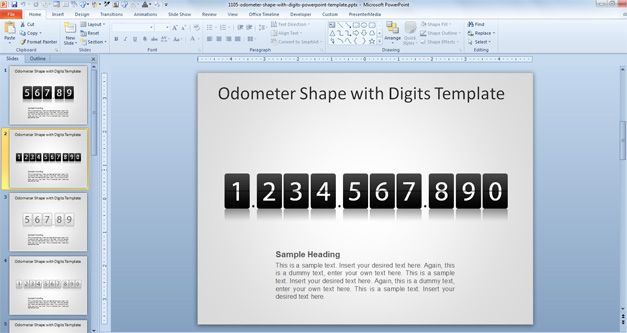
The free slide template with odometer digits contains a light and dark style that makes possible to create presentations with odometer very useful for dashboards and panels in PowerPoint.

The digits are editable using shapes in PowerPoint so you can reproduce any desired number. Alternatively you can download other free PowerPoint shapes, vectors, illustrations and PowerPoint backgrounds for rich presentations.
License: cc by 2.0
![]()
Related Presentation Templates
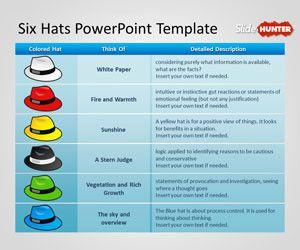
Six Hats PowerPoint Template
This six thinking hats PPT template facilitates the design thinking process and individual thinking.
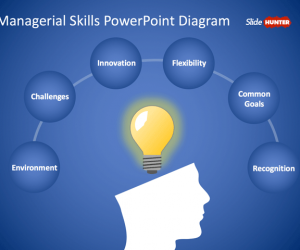
Free Managerial Skills PowerPoint Template
Free presentation slide template on managerial skills, suitable for a variety of audiences such as corporate teams, management trainees, or business students.

Free Marketing PowerPoint Template
Download a 100% editable free Marketing PowerPoint template with professionally designed slides for PowerPoint & Google Slides.
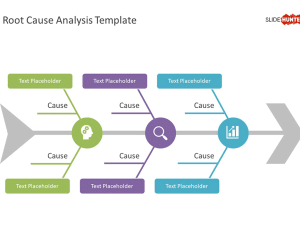
Free Root Cause Analysis Template for PowerPoint
A three-tier structured Root Cause Analysis slide template for PowerPoint presentations, with fishbone diagram, enables in-depth root-cause analysis with visual impact.