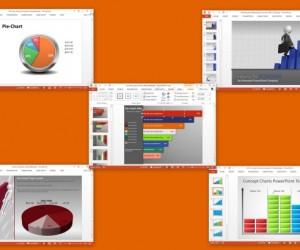
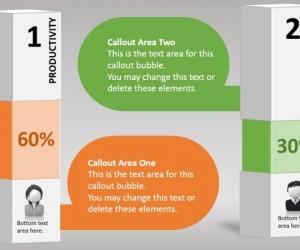
SlideHunter Logo
  • Blog
  • Shapes
  • Diagrams
  • Slides
  • 3D
Popular Search Timeline Roadmap SWOT Process

Charts

Learn how to make charts in PowerPoint so you can display tabulated data using a nice visualization tool. The articles under this category will show you how to make popular charts in PowerPoint like line chart with data points, pie charts as well as other more advanced charts like the Gap Analysis chart in Microsoft PowerPoint 2007 and 2010.

Best Websites to Make Infographics (with Examples)

Animated Graph Template for PowerPoint

Animated wheel chart PowerPoint template

Animated Wheel Chart PowerPoint Template

Best Free Graph Makers & Online Drawing Tools

Animated Transport Truck PowerPoint Template

Create Amazing Maps in Excel with Power Map Add-in

Create And Share Professional Looking Charts Online With ChartBlocks

Quickly Create Online Charts By Entering Data Using Chart Creator

Best PowerPoint Templates With Charts And Graphs

Display Graphs As Infographics With Graph Blocks Template For PowerPoint

Create Professional Looking Business Presentations With Slidevana

Free Editable Charts in PowerPoint

Advertisement
1 2 Next »
Advertisement

Popular Topics

Fishbone Funnel Sales 3D Root Cause Analysis Comparison Sales Pipeline Agenda Venn Diagram Change Management Shapes Process Charts Sales Funnel
Advertisement
SlideHunter Logo
  • Contact
  • Privacy Policy
  • About
  • Advertise Here
  • Write for Us

PowerPoint is registered trademark of Microsoft Corporation and this site do not have any relationship with Microsoft Corp. We are an independent website offering free presentation solutions and free PowerPoint backgrounds for presentations.