Graphical representation of data is an integral part of our socio-economic setup. Be it poll results or the annual sales chart, representing complex data is easier in the form of graphs and charts. There are a number of ways that one can represent the same set of data. One can use pie charts, bar graphs, line graphs, Venn diagrams and the list goes on.
There is just one problem, representing the data accurately and having a spectacular way of doing that. Simplifying the data and representing it in an engaging manner is all that is needed and Chart Creator allows you to achieve both goals in one shot.

What is it all about?
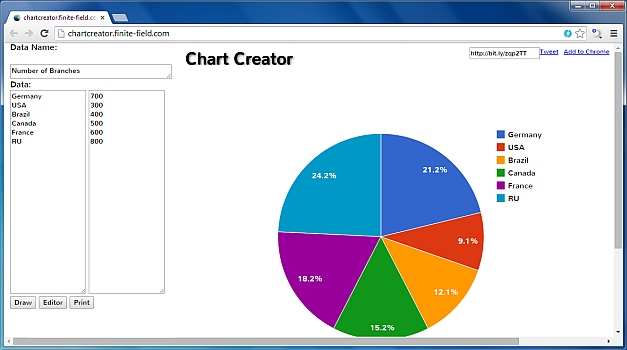
Chart Creator is an amazing web application that allows the user to create, edit, modify, enhance and share pictorial data representations in an easy and convenient manner. The application simply converts the data that you provide into the representation that you select. You can quickly create online charts by entering data in ‘Chart Creator’.
All that you can do with Chart Creator:
With Chart Creator you can easily create, edit, customize and share charts and instantly use them. Below are a few details about what can you do with this web app.
Create
Once you start the application, a beautiful and simple interface welcomes you. There are well laid out menus for the type of chart you want to use. All you need to do is select the chart of your liking and click on the edit button.
Edit
Once you start editing, all you need to worry about is entering the right data. The web app takes care of the rest for you. You can continue to add the data and witness the changes in the relevant chart form that was selected by you. Once you are done with the editing part, you can either print the chart that has been generated or move on to customizing it to suit your liking.
Customize
The customize option allows you to re-size columns, change colors, edit the text or altogether create a template for yourself. Once you are done with the representation of the data all you need to do is click on the print button and you are ready to go.
Chart Creator is a quick, simple, and amazing way to generate superb and crisp graphical representations of data that you need to present to an audience.
Share
You can also share your charts using the given sharing URL or the Tweet button, located at the top right corner.
Chart Creator is a convenient solution if you want to create charts for your presentations and present socio-economic data to an audience. It can also be combined with other tools and make visually appealing graphics from complex data sets or results gathered from complex surveys.
Go to Chart Creator


