Charts and diagrams form an important part of professional presentations where one might require projecting trends, forecasts and technical models. The Graph Chart Trends Animated Template for PowerPoint can be used for projecting trends using animated, editable charts and diagrams.
Animated Chart Slides
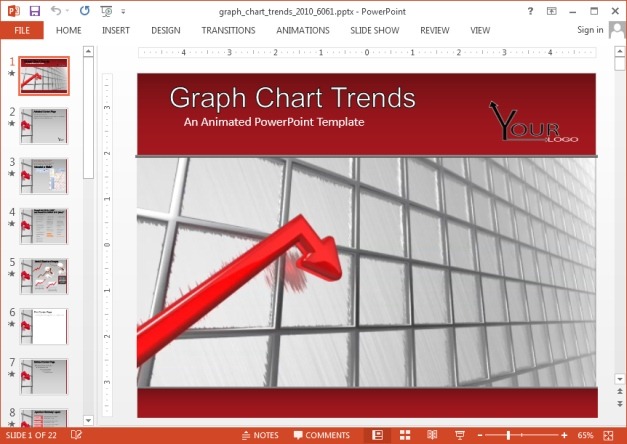
This graph template contains many animated chart slides, which can be edited using PowerPoint chart tools to create your own custom charts. The title slide depicts an animation of a moving arrow, which is displayed on the side of various slides throughout the template. You can also disable this animation via ‘Layouts’ option from the PowerPoint Home tab.
Easy to Grasp Chart Layouts
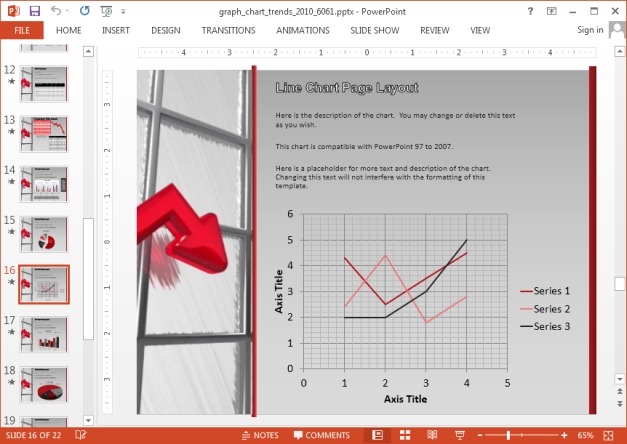
The template provides a number of sample chart slides with pie, bar and line charts. The colors in these charts are particularly well-matched, which can help you present various parts of your data in an easy to grasp form.
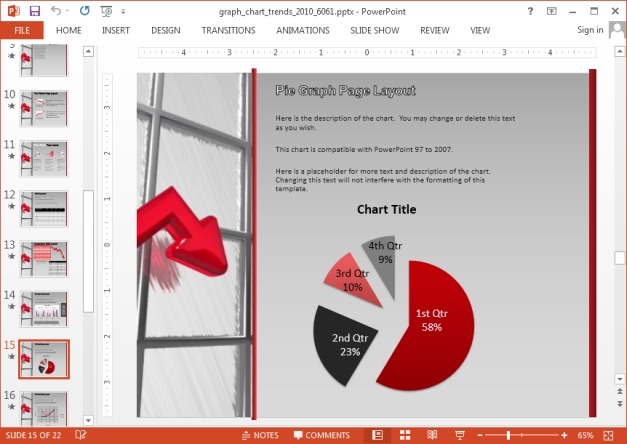
Needless to say, you can add text to the placeholders to explain details about projected trends. The chart layouts are quite spacious for adding text, with a good balance of space for showing charts and adding descriptions, titles and sub-titles for your charts.
Label to Create Diagrams
There are also various sample diagrams in this template which can be labeled to present your own information. You can also format them to change the color, size and shape of diagram elements.
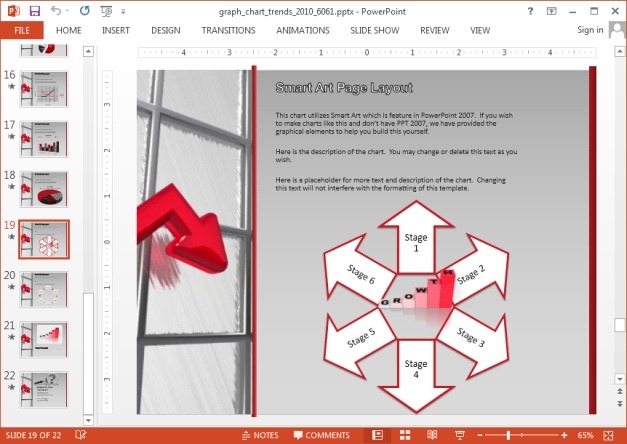
Chart Clipart for PowerPoint
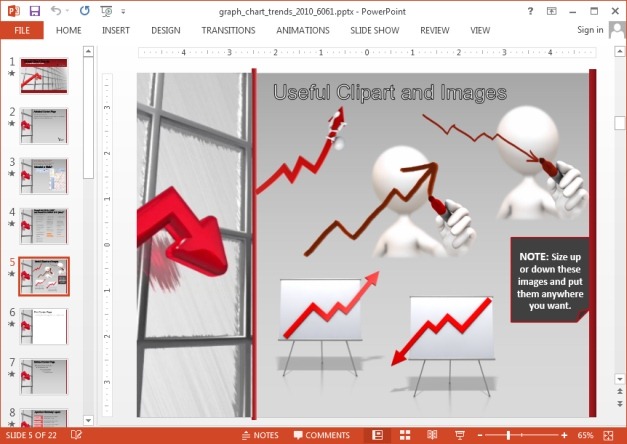
There are also trend themed clipart images within this template which you can use to make your slides more interesting. These images can be resized and copied across slides as per your requirements.
You can download a Standard or Widescreen version of this template for all recent editions of Microsoft PowerPoint.
Go to Presenter Media – Graph Chart Trends Animated Template for PowerPoint (Standard)
Go to Presenter Media – Graph Chart Trends Animated Template for PowerPoint (Widescreen)
Alternatively, you can download other presentation slides and free PowerPoint templates, with 100% editable placeholder text and images.


