Home   PowerPoint Tutorials

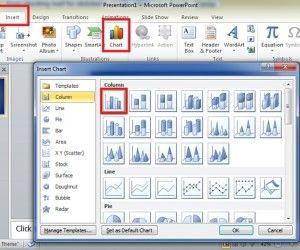
How to Make Bar Graphs in PowerPoint 2010 using Excel Data

As a presenter, you probably use charts in your presentations. Charts display data in a visual format that audiences can easily grasp. The quality of good chart is that it shows only the data necessary to make the desired point clear – no less, no more. Too much data will overwhelm your audience, blunting your message. […]

What are the Benefits of Oral Presentations

You must have participated in some elocution, recitation or extempore contests during your school days. What was the experience like? Searching for an interesting and unique topic Researching on how to make it even more impressive Practicing dedicatedly (especially in front of the mirror) Then the adrenaline gush, as your name is announced for the […]

Advertisement

How to Get Attention when Presenting a PowerPoint Presentation

PowerPoint Presentation is in itself an engaging technique, and when presented with the fervor of a professional and enthusiast its appeal is enhanced. Having said that one cannot deny that it is an equally  crucial application, to keep the audience enchanted throughout, you have to cast the spell of articulation and creativity. The countdown to […]

How to Use a Simple Background in PowerPoint 2010

In PowerPoint 2010 you can easily change the slide background or presentation background from the Design menu. Here we will show you how to change the background to use a simple background design with gradients. This can be helpful for simple presentations or even for PowerPoint templates. Easily you can change the plain default background […]

How to Use Chart Analysis Tools in PowerPoint 2010

In PowerPoint presentations, Analyzing chart data involves utilizing data obtained from research and representing it using PowerPoint features, such as charts and tables. Analyzing quantitative data usually involves examining the results and identifying patterns and trends. Chart analysis shows the distance between high and low points as well as make predictions on increase and decreasing values […]

How to Use Chart Layout in PowerPoint

PowerPoint provides a Chart layout tool that is used to communicate data graphically. Displaying charts in PowerPoint allows your audience to see the meaning behind the numbers, and they make showing comparisons and trends a lot easier. Learn use of chart layouts in PowerPoint, so that you can communicate your information effectively. To get option […]

Advertisement