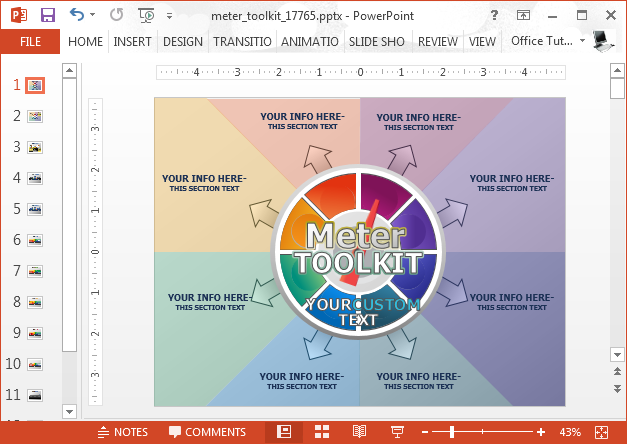
Gauge or meter diagrams are handy for giving your audience an instant impression about a specific topic, be it a positive or negative impression. For example, a gauge that shows the arrow tilting towards the left can be a sign of bad performance and vice versa. But having a standalone gauge illustration isn’t necessarily enough to create a robust slide. This is why you can use the Animated Meter Toolkit for PowerPoint which comes with editable, colorful gauges.
Edit Placeholders and Meter Dials to Reflect Performance
The best thing about this gauge themed template is the ability to change the dial of the meters. Moreover, you get a number of additional customization options such as the utility to recolor and rearrange elements within slides.
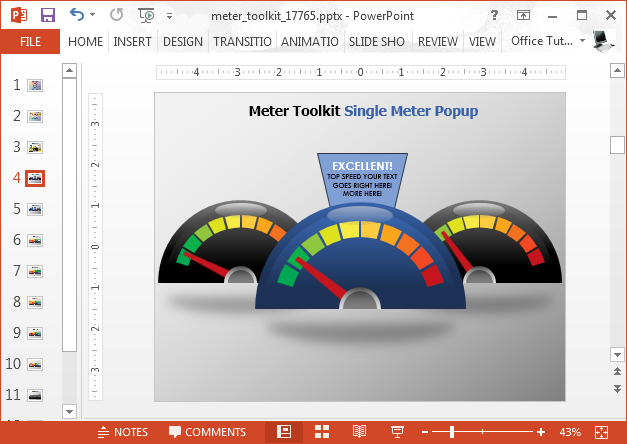
Tooltips to Help You Customize Meter Layouts
You can edit the meter layouts by following the simple instructions in the form of removable tooltips. You can also play around options from the PowerPoint Ribbon menu and make your own layouts by using drag and drop to rearrange slide elements. There are single and multiple gauges across different slides with the option to add or remove meters as you please.
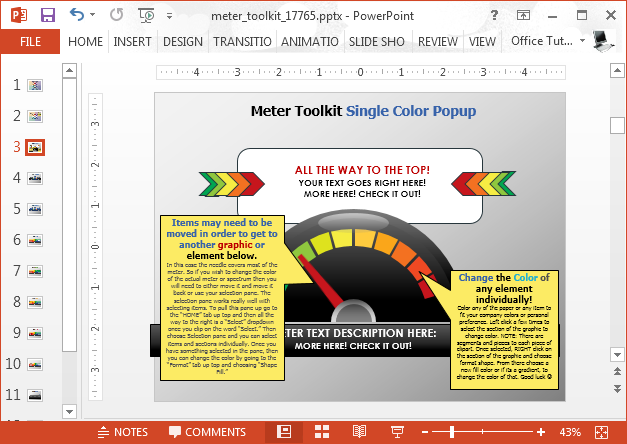
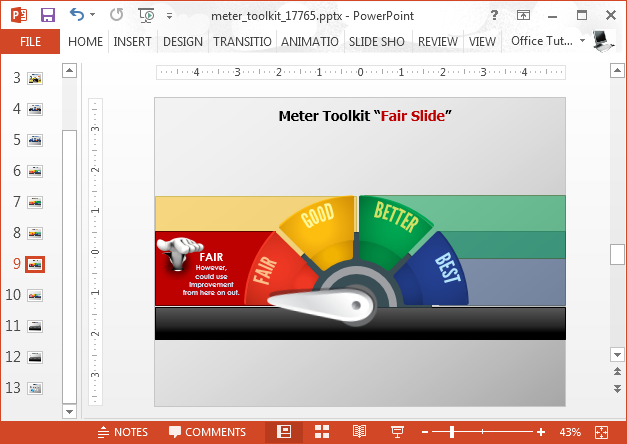
Sample Layouts with Performance Ratings
There are sample layouts with performance ratings that can give you an easy start when making your slides and diagrams. These slides depict a meter at high medium and lower levels with a subtitle and clipart image to describe the rating (Best, Better, Good or Fair).
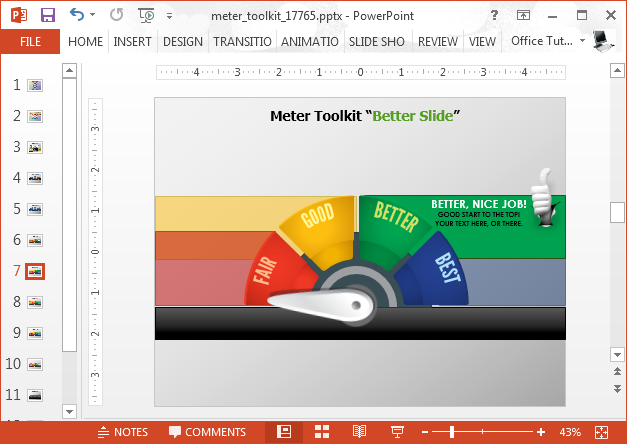
You can also add or remove the subtitles and clipart and replace them with your custom text and clipart according to need.
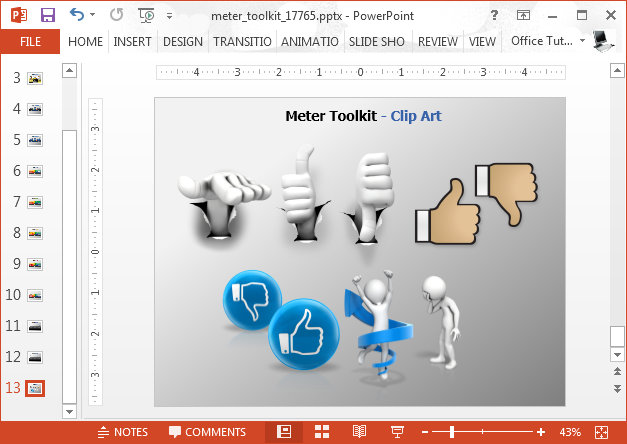
Performance Clipart
A dedicated clipart slide in the template gives you useful images which can be used to visually represent performance. For example, if you want to present a good sales quarter with some zeal, you can use the jumping stick figure or the thumbs up clipart with a gauge layout that shows the meter at top speed.
This gauge template can be used for making anything from standalone diagrams, infographics to entire presentations related to virtually any topic. You can create presentations tied to business, engineering, Formula 1 or Grand Prix, as well as to present topics related to success, career, performance reports, etc.
Go to Presenter Media – Animated Meter Toolkit for PowerPoint