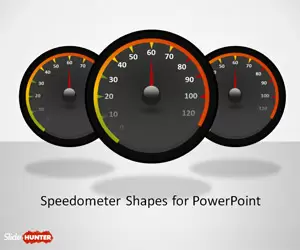
Free Dashboard Speedometer Shapes for PowerPoint is an excellent presentation template for Microsoft PowerPoint that you can use to make awesome dashboards with meters and gauge designs.
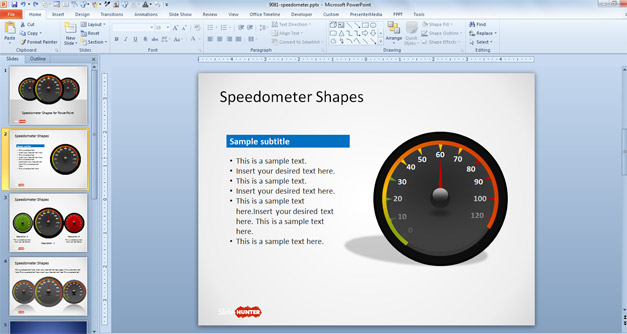
Inside this free PowerPoint car dashboard template for PowerPoint presentations you will find multiple dashboard speedometer designs for presentations that were created using native shapes and you can edit to match any desired style.
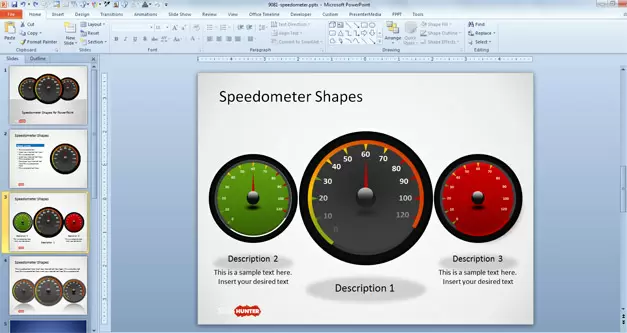
By using gauges like the speedometer dashboard template for PowerPoint you can specify a minimum, a maximum and current value as well as highlight the range that is dangerous in a KPI metric.
Gauges are not only used by managers or for business presentations, doctors also use gauges like thermometers or bullet charts. For example, the figure below shows the gauge with the needle pointing to the value 60 and the gauge starts from a minimum of 0 to a max value of 120. You can see the color changing gradually from green to red with a gradient style.
Alternatively you can download premium professional PowerPoint templates for presenting Key Performance Indicator and Dashboards in PowerPoint.
License: cc by 2.0
![]()
Related Presentation Templates
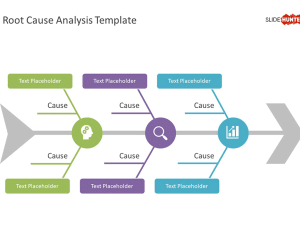
Free Root Cause Analysis Template for PowerPoint
A three-tier structured Root Cause Analysis slide template for PowerPoint presentations, with fishbone diagram, enables in-depth root-cause analysis with visual impact.
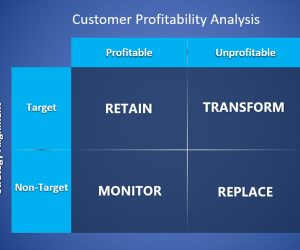
Free Customer Profitability Analysis PowerPoint Template
Download free CPA template with a matrix containing Reatain, Transform, Monitor and Replace components.

Free MVP PowerPoint Template
Free slide template for Minimum Viable Product presentations, with 100% editable placeholders.
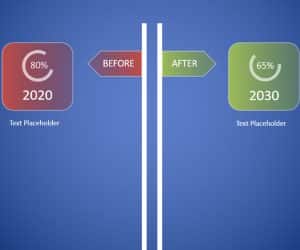
Free Before & After PowerPoint Template
Download a Before and After slide template for PowerPoint presentations, to compare a past situation with a future situation.