Using Adobe Presenter to Make Rich PowerPoint Presentations
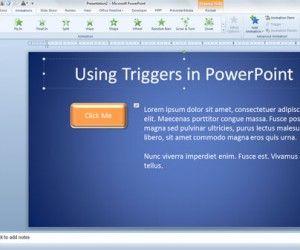
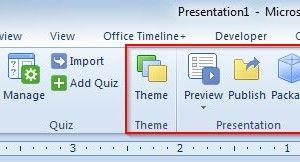
Adobe Presenter 8 introduced new features that can help you to make richer PowerPoint Presentations using the Adobe Presenter Add-in plus the Video recorder. You can download a free trial of Adobe Presenter 8 and try it before purchasing the product. It will install a new tab in PowerPoint 2010 where you can create nice […]