Control chart in PowerPoint is a tool used for SPC (statistical process control) in manufacturing operations. The chart graphically shows process steadiness by plotting the occurrence of defined events or particular values or measurements. Upper and lower control limits are made evident to display when plotted data for an event or value falls outside the predicted norm. Control charts are generally used to observe process efficiency, to evaluate the effect of any changes made to how the process operates and to find opportunities for improvement or events requiring corrective action.

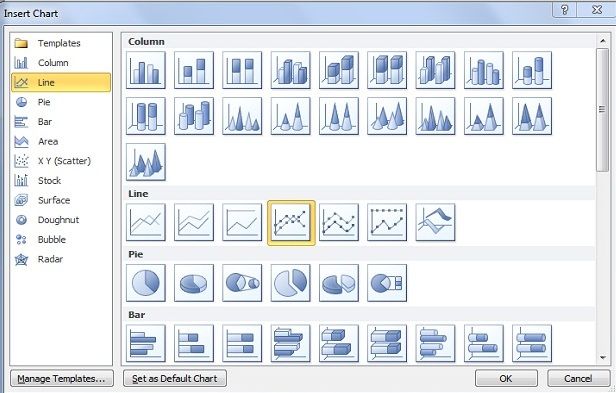
To create a simple control chart in PowerPoint, It is not obligatory to create a control chart from scratch. Templates are available in power point 2010 from resources such as the American Society for Quality (ASQ).
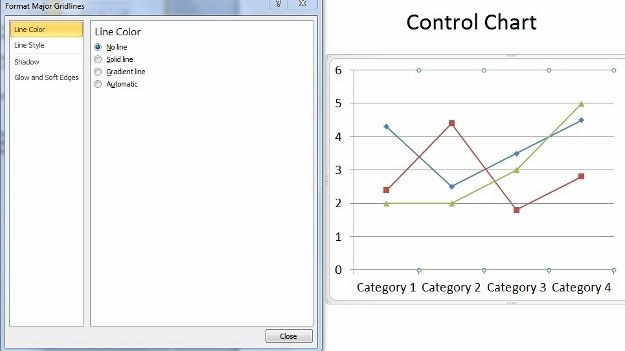
Remove background lines of control chart to look more neat and clear.
Now, you can add the control lines to the chart. Simply insert a horizontal line in PowerPoint using shapes. You can draw the horizontal line in PowerPoint by using the shape tool.
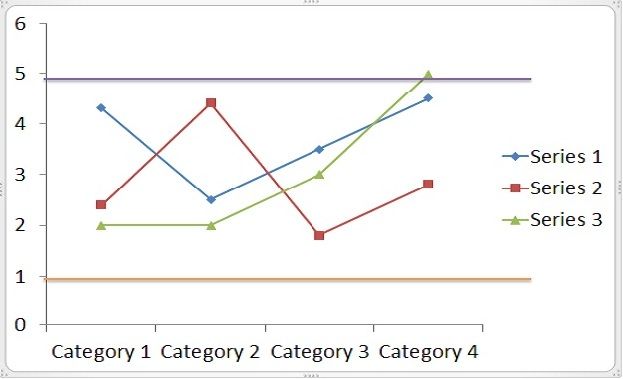
Make certain to enter line inside the chart area, for this purpose, hold the Alt key to move the lines to any intended location to override the grid settings.
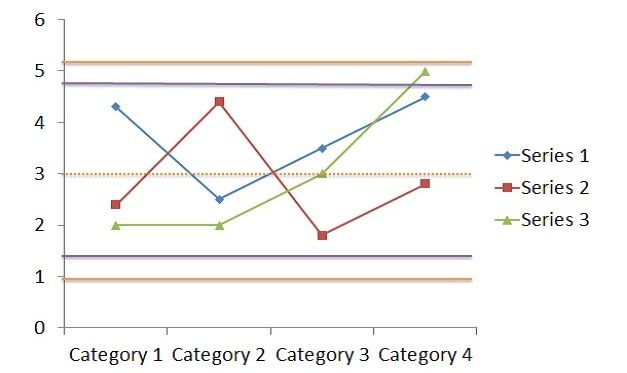
To define multiple zone rules, use the similar approach to create multiple control lines. The Western Electric Rules are decision rules for detecting out-of-control or nonrandom conditions on control charts and it is also used in the field of Statistical Process Control. Copy the lines you have added earlier and then change the color for the top and bottom bands. You can also use a red color and then an orange color to distinguish the limits of the control. Upper and lower control limits must be defined based on actual process results from historical data in order to be accurate. Defining such limits outside the process parameters, for instance, from customer specifications, will not validly identify process capability.
Download free PowerPoint templates, diagrams and chart templates for PowerPoint for free from Slide Hunter.