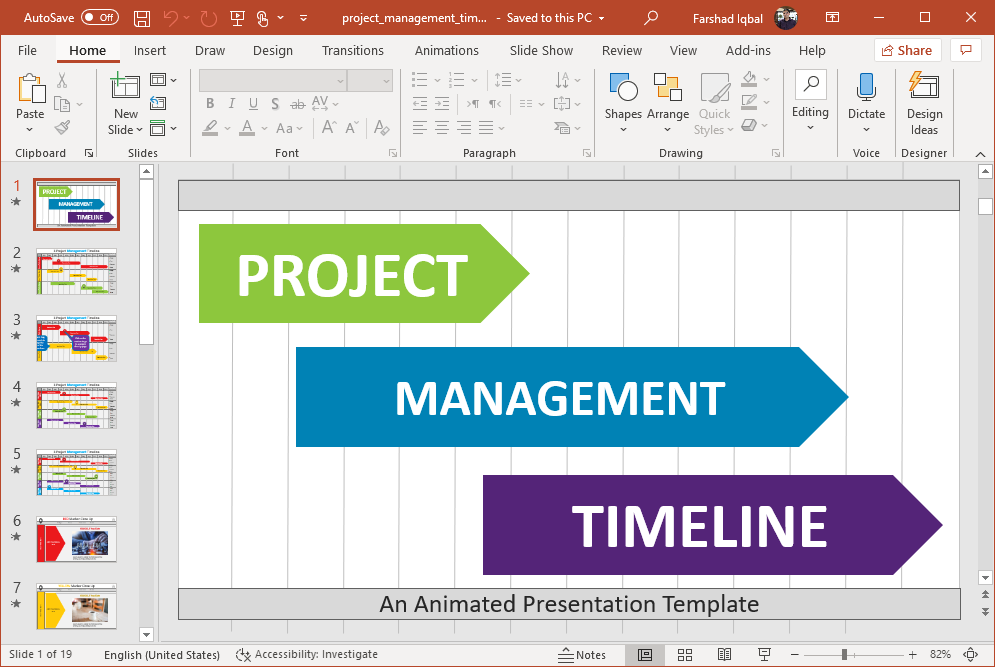
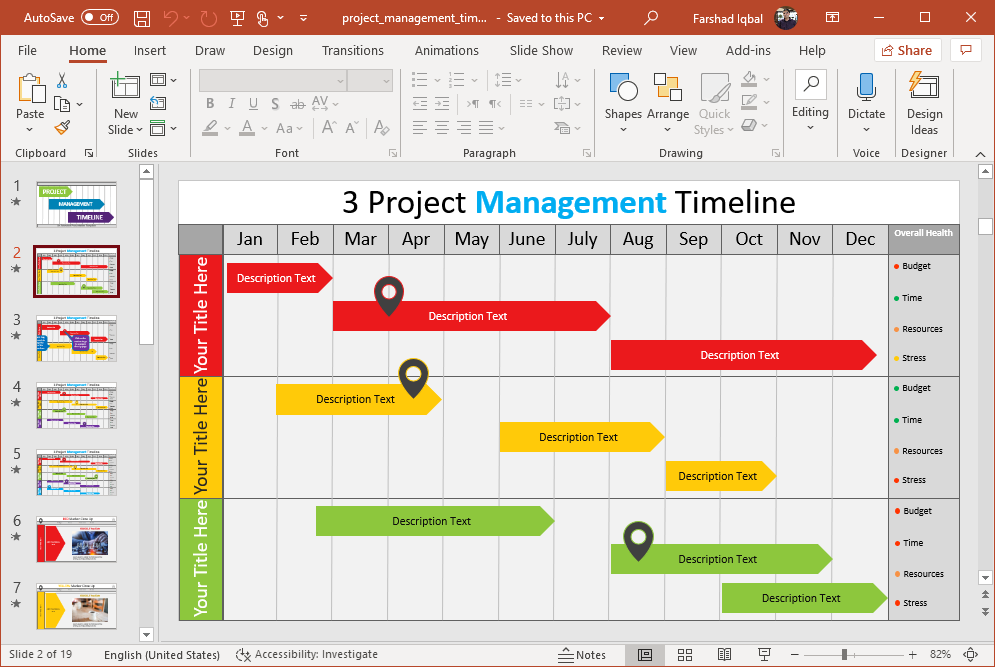
One of the methods of creating a timeline is in the form of a Gantt chart. These charts illustrate a schedule for a project, as well as dependency relationships for schedules and activities. To easily create project Gantt charts, you can use a template with Animated Project Management Timeline Gantt Charts for PowerPoint.
Animated Gantt Charts
Since Gantt charts are rather simple illustrations, the template makes use of this minimalist concept to provide PowerPoint slides in simple layouts. To add some oomph to the slides, the slide deck comes with animations. This can help you create animated Gantt charts by editing the given layouts.
Color Coded Gantt Charts
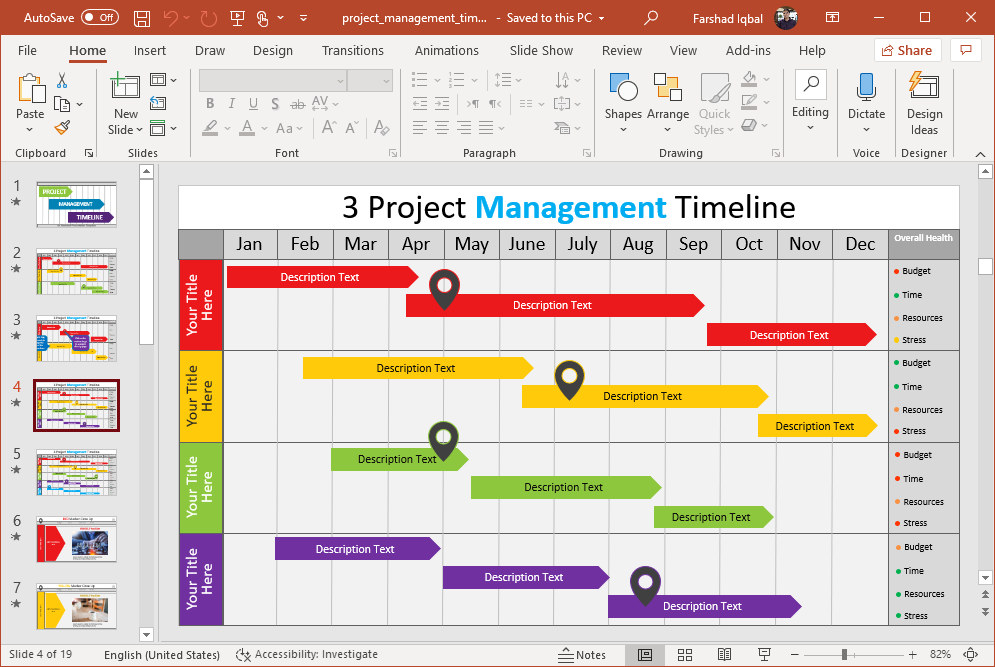
You can use the color-coded layouts to give color to various activities, milestones and project specifics. There is a key on the right side of each Gantt chart with sample text suggesting a meaning for each color. You can replace this according to need. For example, you can replace the color given to budget, time or resources. You can also expand the Gantt chart to design your project breakdown by editing the design elements using drag and drop.
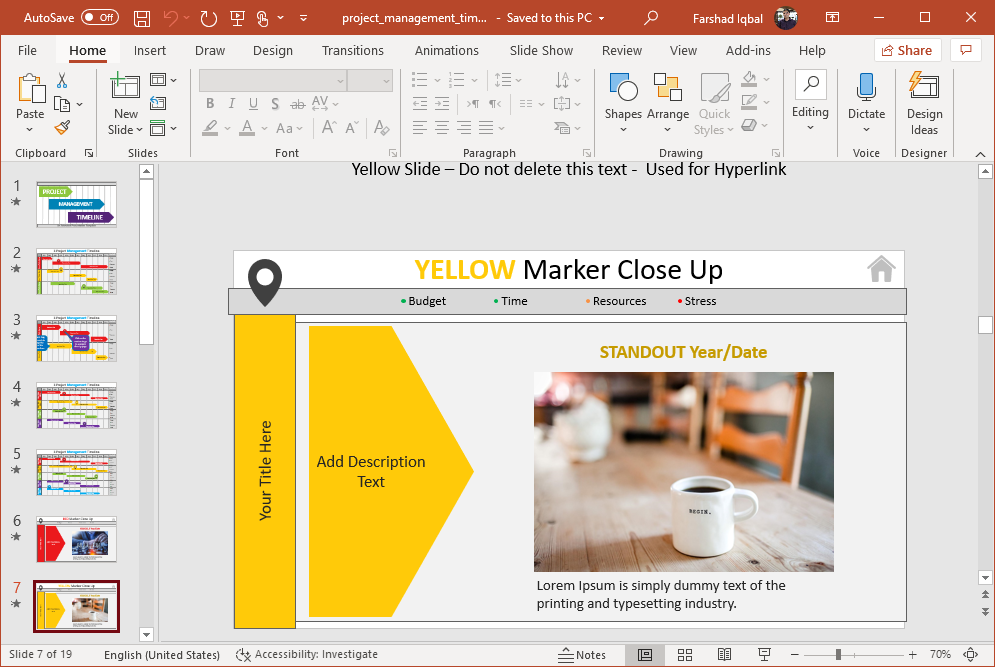
Some of the colors used in this template to define key areas include, red, blue, yellow, purple and green. There are also slides dedicated to each color with a sample image to help you create slides which can explain the relevance of the color in the presentation.
Change Colors of Gantt Chart Elements
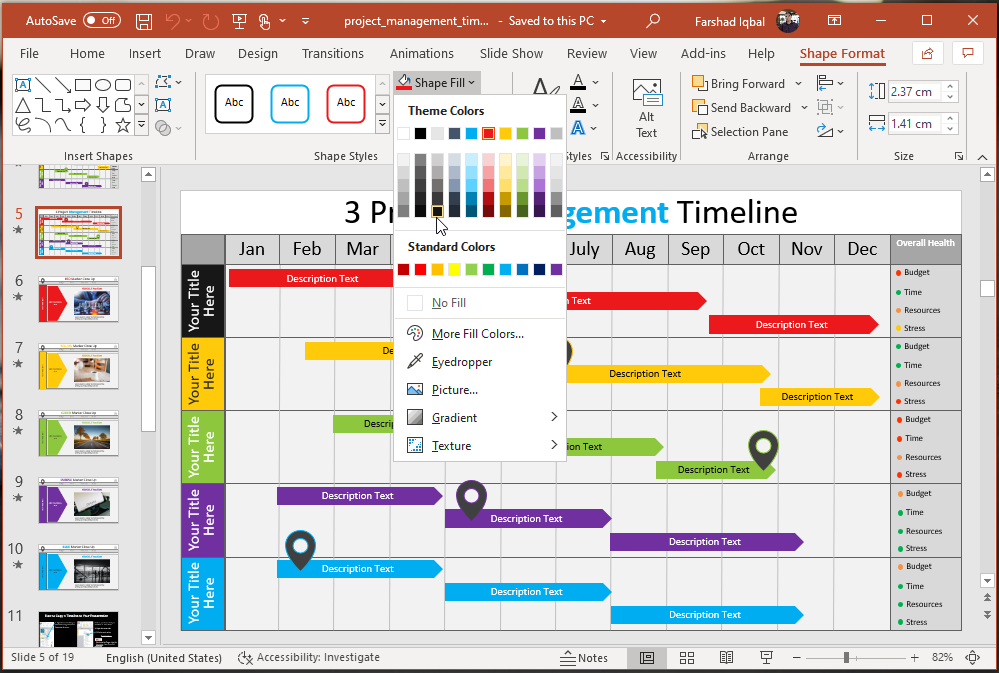
You can change the color for any of the slide elements by going to Shape Fill via Shape Format in PowerPoint.
There are 4 Gantt chart slides in the template, one opening slide and five dedicated to each color used in the template to mark the Gantt charts. You can also duplicate to extend the Gantt timelines in the slide deck.
Go to Presenter Media – Animated Project Management Timeline Gantt Charts for PowerPoint
