Comparison slides can be the most difficult to explain. Making large chunks of data easy to understand in cohesive tables and comparison layouts can be hard to present. The audience can often be left lost in translation, as the comparison layouts that are conventionally used are quite minimalist. What if you could make a complete presentation based on comparison slides that are easier to grasp and present? The Animated Comparison PowerPoint Template is a template meant for just that.
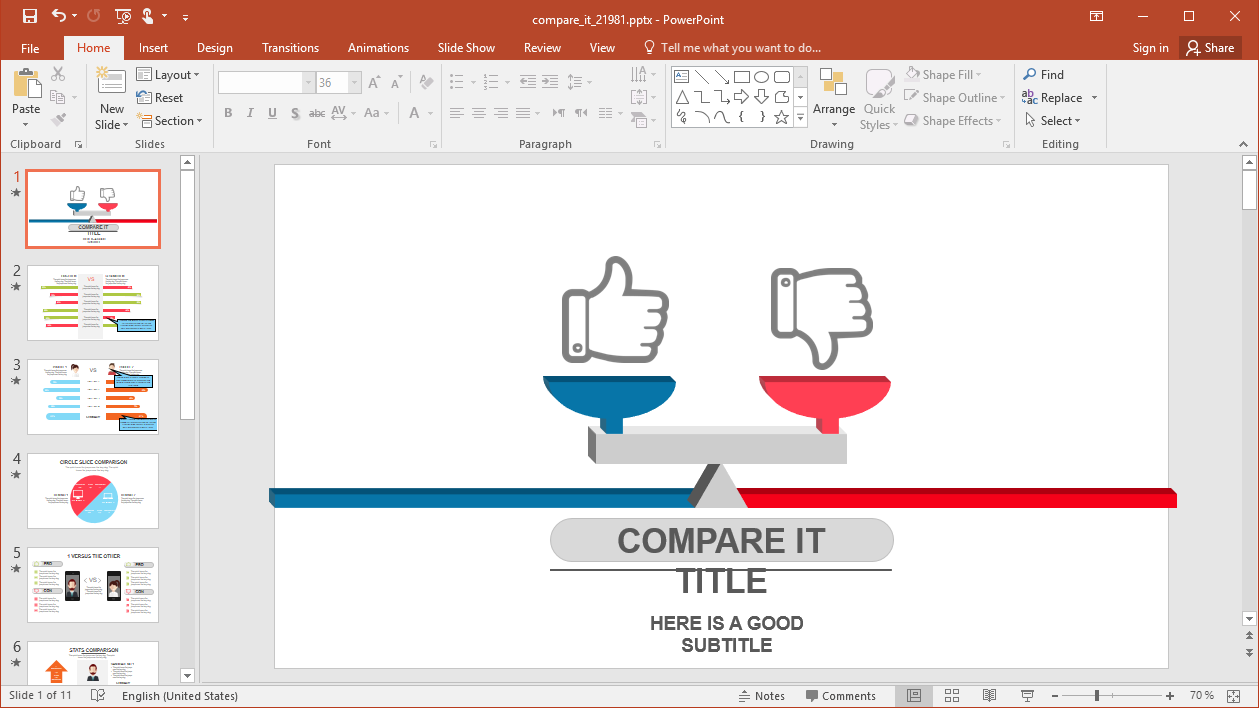
Create Comparison Slides with Infographics
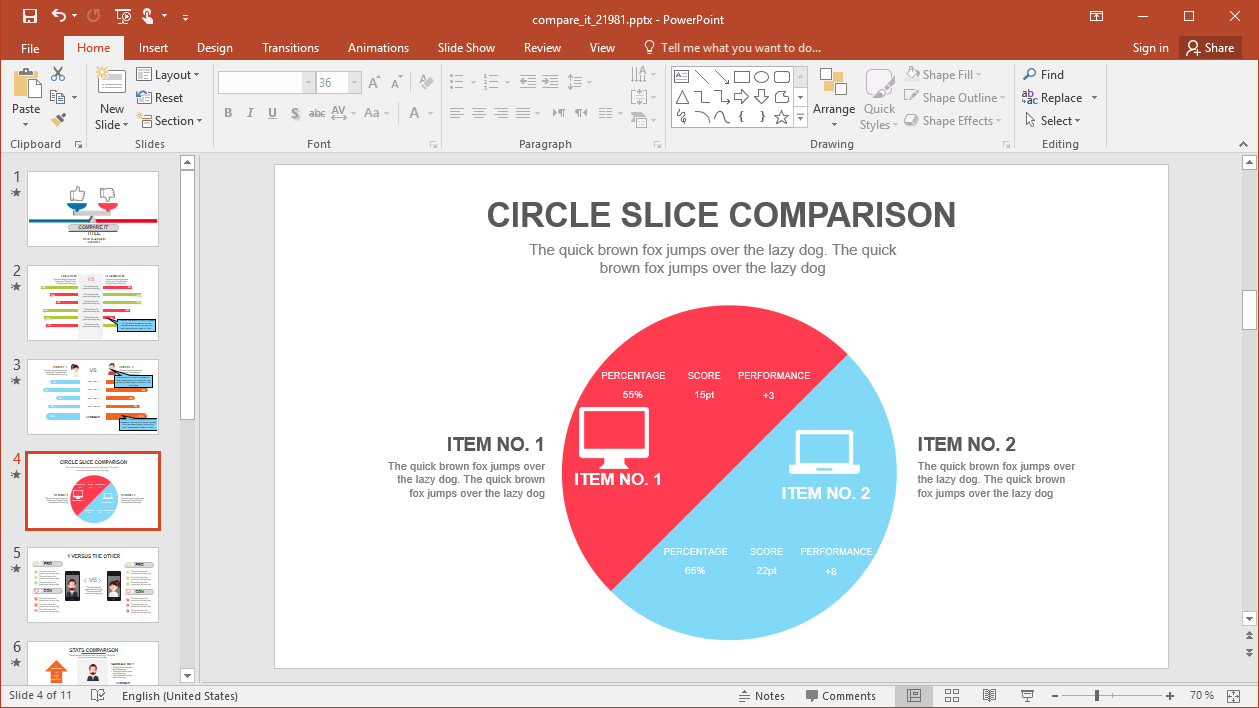
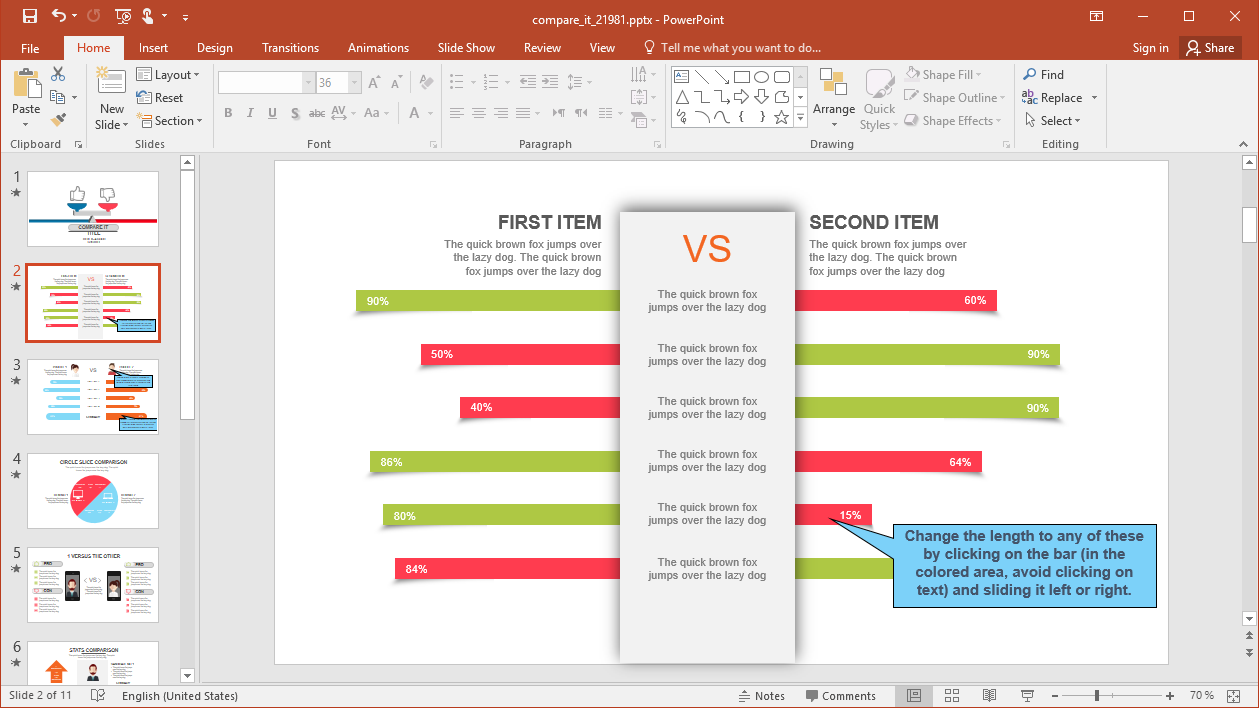
With easy to present comparison slides, the template provides graphical elements to help you create infographics and easy to understand comparison layouts. You can play around with the sample layouts to create slides, which can help you explain your content with ease.
There are layouts with infographics and animations, which can be easily edited by adding content to the placeholders. These placeholders come with animations added to them, making it possible for you to generate animated slides in no time.
Comparison Charts and Tables
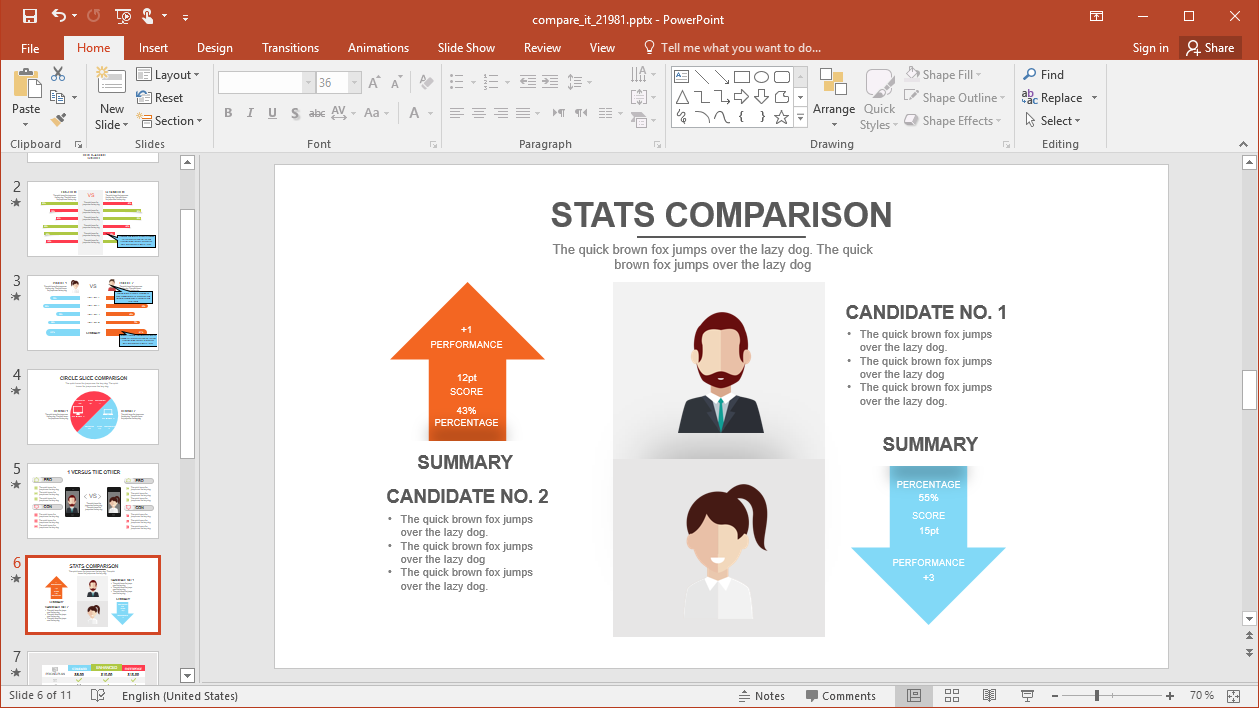
There are also slides which provide sample charts and tables, which you can edit to create your comparison slides. Some of the slides can help make your content easier to explain using pros and cons or with the visual help of arrows moving in opposite directions (upward and downward). These illustrations can be used as a guiding tool to show the merits and demerits of things that are being compared.
Comparison Icons
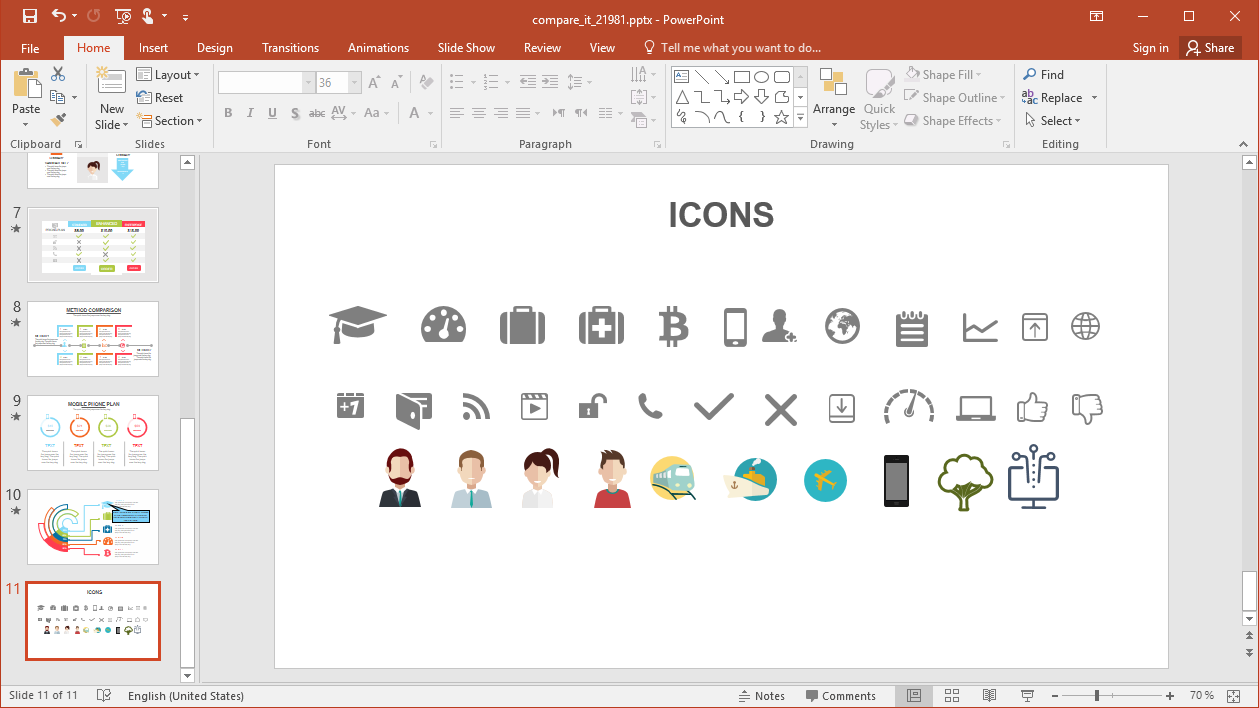
The icons slide in this template gives various comparison icons. These icons can be used for generating your own comparison layouts or to edit the sample layouts with a few tweaks of your own. These icons contain symbols which can be used for multiple topics and all of them are pretty much self-explanatory in nature. You can further refine what each icon represents by adding explanatory text.
Go to Presenter Media – Animated Comparison PowerPoint Template
