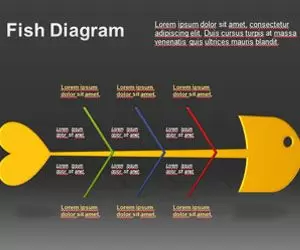
Fish Diagram for PowerPoint is another impressive free fish diagram for presentations in Microsoft PowerPoint. You can free download diagrams like fish diagrams to make presentations and impress your audience.
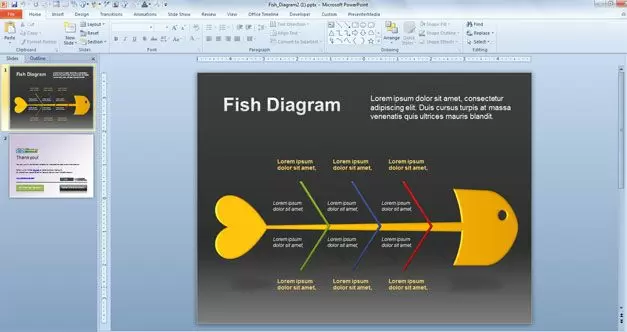
The graphic in the screenshot shows one of the slides available in this fishbone diagram template for PowerPoint.
Fishbone diagrams are also called Ishikawa diagrams or herringbone diagrams, cause-and-effect diagrams, or Fishikawa. These kind of diagrams are causal diagrams created by Kaoru Ishikawa (1968) that show the causes of a specific event. Common uses of the Fish Diagrams are product design and quality defect prevention, to identify potential factors causing an overall effect.
This free fish diagram has a fish style but similar to the diagram. Causes in Fishbone diagrams are usually grouped into major categories to identify these sources of variation. The categories typically include: people, methods, machines, materials, measurements and environment. You can free download Fish Diagram for Microsoft PowerPoint.
License: cc by 2.0
![]()
Related Presentation Templates

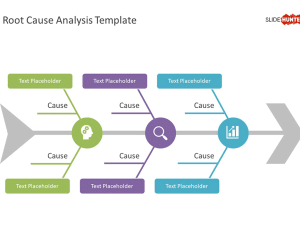
Free Root Cause Analysis Template for PowerPoint
A three-tier structured Root Cause Analysis slide template for PowerPoint presentations, with fishbone diagram, enables in-depth root-cause analysis with visual impact.

Free MVP PowerPoint Template
Free slide template for Minimum Viable Product presentations, with 100% editable placeholders.
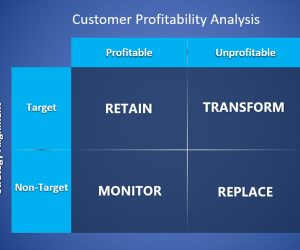
Free Customer Profitability Analysis PowerPoint Template
Download free CPA template with a matrix containing Reatain, Transform, Monitor and Replace components.