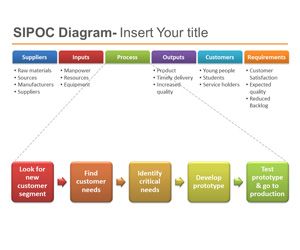
This is a free SIPOC Six Sigma template for PowerPoint with a SIPOC diagram design in the presentation slide that you can use to make your slides presenting a SIPOC Analysis.
SIPOC Diagram with colors is a free PowerPoint template that you can download for free to make attractive Six Sigma presentations using Microsoft PowerPoint.
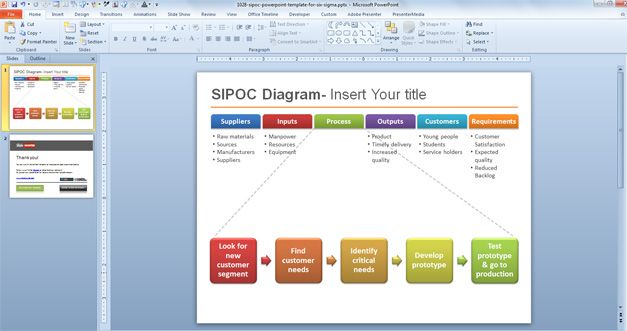
You can download this free six sigma tool and SIPOC example for SIPOC Analysis and
Download the free SIPOC template for PowerPoint with a process mapping design and many different SIPOC diagrams that you can customize using shapes and styles. Also, you can combine this template presentation with other tools and software, including Microsoft Visio and print the SIPOC diagram as a PDF template.
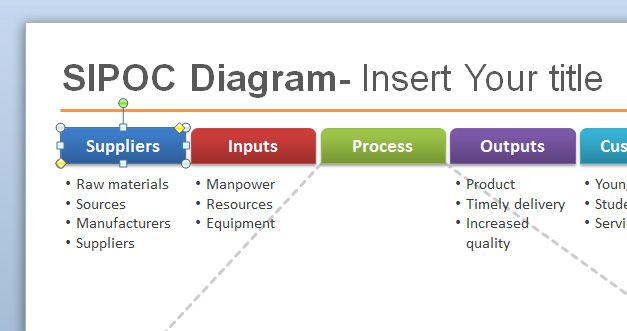
As you can see, the SIPOC diagram with a process mapping illustration includes shapes in different colors for the elements, including Suppliers, Input, Process, Outputs, Customers, and Requirements. Then you can also detail the sub-categories, including Raw materials, sources, manufacturers, suppliers, workpower under Inputs, resources, equipment and product, timely delivery, and increased quality. You can also add information about the customer segmentation, for example, targeting young people, students, and service holders and then under requirements customer satisfaction, expected quality, and reduced backlog.
License: cc by 2.0
Related Presentation Templates
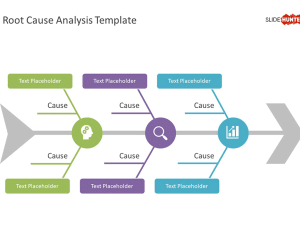
Free Root Cause Analysis Template for PowerPoint
A three-tier structured Root Cause Analysis slide template for PowerPoint presentations, with fishbone diagram, enables in-depth root-cause analysis with visual impact.
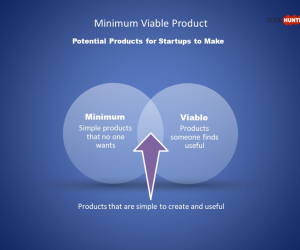
Free MVP PowerPoint Template
Free slide template for Minimum Viable Product presentations, with 100% editable placeholders.
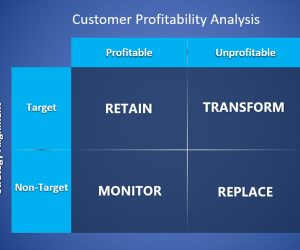
Free Customer Profitability Analysis PowerPoint Template
Download free CPA template with a matrix containing Reatain, Transform, Monitor and Replace components.
Free Before & After PowerPoint Template
Download a Before and After slide template for PowerPoint presentations, to compare a past situation with a future situation.
