Free KPI Indicators PowerPoint template is a simple slide design with shapes that you can use in dashboards as Key Performance Indicators.
With dashboards like the free dashboard PowerPoint design you can provide at a glance views of Key Performance Indicators (aka KPI) relevant to a particular objetive, goal or business process. This is widely used for sales, marketing, human resources and production, but you can also use it for a variety of other topics and needs.
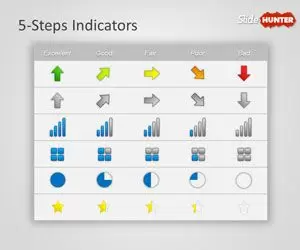
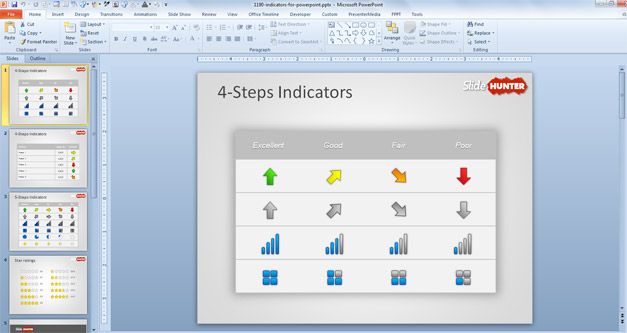
Inside this free PowerPoint template you can find useful shapes and graphics to make presentations with awesome dashboards and KPI. You can download the free KPI Template for PowerPoint and use the 4-step indicators or 5 step indicators to show trends or as directional indicators. For example, the directional arrows in different colors let you easily represent an indicator state as excellent, good, fair or poor or show a positive or negative trend.
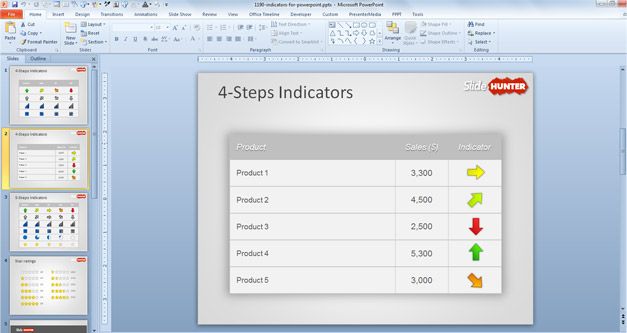
You can also use the star rating shapes in PowerPoint or the Harvey Ball shapes for PowerPoint presentations. The template comes with different slide designs very useful to prepare a table in PowerPoint to be used with indicators. Alternatively you can use the Balanced Scorecard template for PowerPoint from Kaplan and Norton or the KPI Table for PowerPoint with an alternative way to show arrows in a table.
Here are examples of applications for different industries and sectors.
- In Marketing you can use the indicators to show trends in new customer acquisition, demographic analysis, status of existing customers, turnover or customer attrition,
- In Supply Chain Marketing you can use indicators to show details of processes for sales forecasts, invetory, procurement and suppliers, warehousing, transportation or reverse logistics.
- In Manufacturing it can be useful for presentations on Cycle Time, Cycle Time Ratio, Utilization of resources and Rejection rate.
Dashboards are normally limited to show summeries, key trends and comparison between concepts but you can also use it to show exceptions or KPI. Dashboards are simple and help to communicate easily the KPI so the reader or audience can get minimum distraction and avoid confusions (as reading a 100 pages business report). Meaning and useful data can be added to the dashboard and applies human visual perception to visual presentation of information.
There are many different kind of indicators like: Quantitative indicators, Qualitative indicators, Leading indicators, Lagging indications, Input indicators, Process indicators, output indicators, Practical indicators, Directional indicators, actionable indicators, financial indicators. Additionally, indicators can be classified using other taxonomies. In some countries it is possible to find sentiment indicators, economic indicators, labor market indicators (KILM).
License: cc by 2.0
![]()
Related Presentation Templates
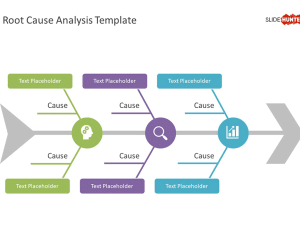
Free Root Cause Analysis Template for PowerPoint
A three-tier structured Root Cause Analysis slide template for PowerPoint presentations, with fishbone diagram, enables in-depth root-cause analysis with visual impact.
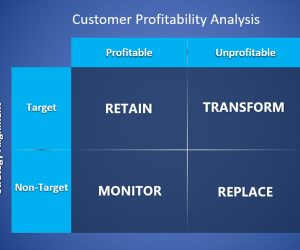
Free Customer Profitability Analysis PowerPoint Template
Download free CPA template with a matrix containing Reatain, Transform, Monitor and Replace components.
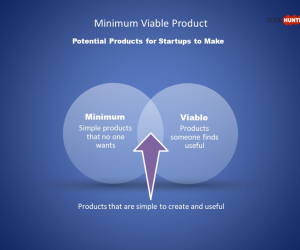
Free MVP PowerPoint Template
Free slide template for Minimum Viable Product presentations, with 100% editable placeholders.

Free Before & After PowerPoint Template
Download a Before and After slide template for PowerPoint presentations, to compare a past situation with a future situation.