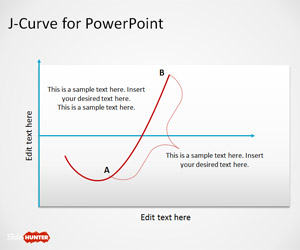
J-Curve PowerPoint Template is a nice presentation chart template with a J-shaped diagram that you can edit to make a curve in PowerPoint with the J-Curve effect. J-Curve is widely used in several different fields to refer a situation where a curve initially falls but then rises to higher than the starting point. This is widely used in business presentations, private equity as well as other financial models.
For example, in private equity the J curve can help to illustrate the past historical trend of private equity funds delivering negative returns in early days but recovering the investment with profitable returns as portfolios of companies mature.
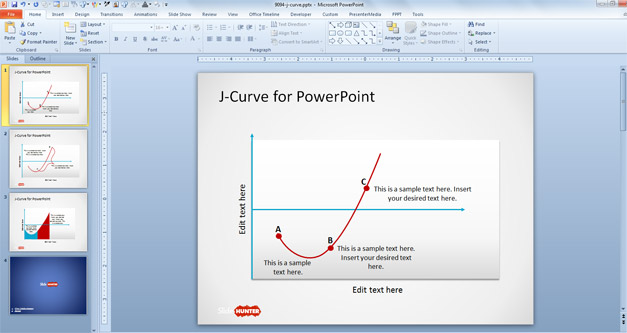
You can use the J-shaped curve for PowerPoint to make presentations on finance and business but also in several other topics, including marketing presentations to show the marketing budget and investment compared with the returns once the marketing campaigns have positive effect, as well as IPO or presentations on mergers and acquisitions, leveraged recapitalizations, etc.
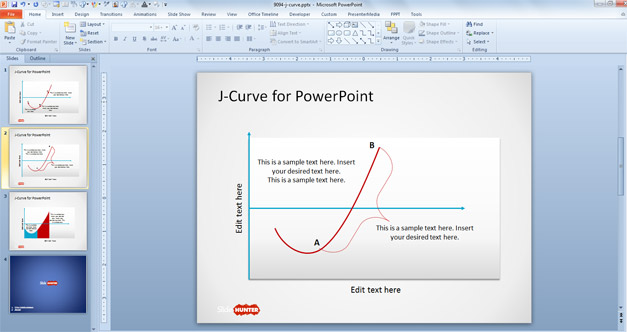
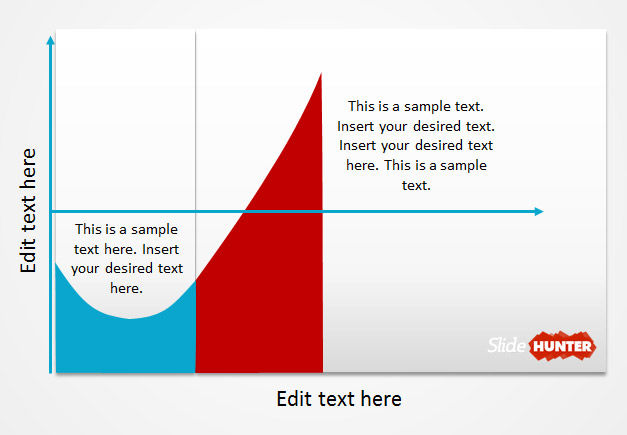
Inside this free J-curve PowerPoint template you will find three unique slide designs with editable curves (created with PowerPoint shapes) and text boxes to enter descriptions.
Alternatively you to this J-Curve style in PowerPoint you can download other nice line charts and curves for presentations including safety charts for PowerPoint, the free PowerPoint line chart template or U-Curve for PowerPoint.
License: cc by 2.0
Related Presentation Templates
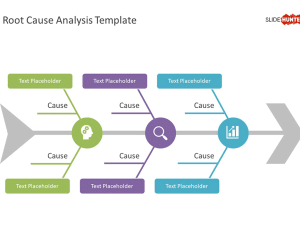
Free Root Cause Analysis Template for PowerPoint
A three-tier structured Root Cause Analysis slide template for PowerPoint presentations, with fishbone diagram, enables in-depth root-cause analysis with visual impact.
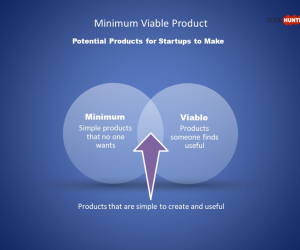
Free MVP PowerPoint Template
Free slide template for Minimum Viable Product presentations, with 100% editable placeholders.
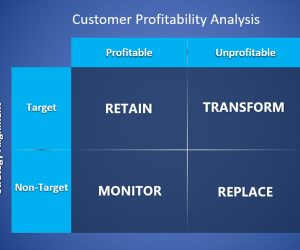
Free Customer Profitability Analysis PowerPoint Template
Download free CPA template with a matrix containing Reatain, Transform, Monitor and Replace components.
Free Before & After PowerPoint Template
Download a Before and After slide template for PowerPoint presentations, to compare a past situation with a future situation.
