You can use Microsoft Graph in PowerPoint to create several types of charts, including line, column, area and pie charts. You can use Microsoft Organization Charts and shapes to create organization charts. Quad Charts in PowerPoint allows for four slides, charts, and any manner of content to be shown on only one slide. The creation of the quad chart requires very few steps. Once your PowerPoint quad chart is created you just need to put in your content, charts, etc. and your presentation is ready!
Open PowerPoint presentation and, go to the Insert tab, then to Shapes and select is lines.
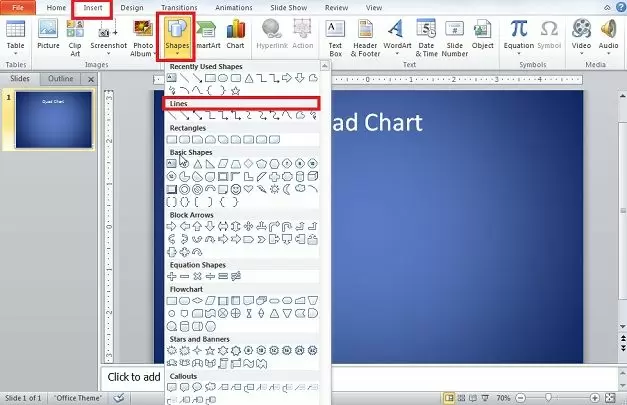
Divide slide area into quadrants. Leave space at the top for header, but essentially you only need two lines. Example of this article is adding a third line to separate the header from the actual quad chart. However it is recommended, select all of the lines and group them.
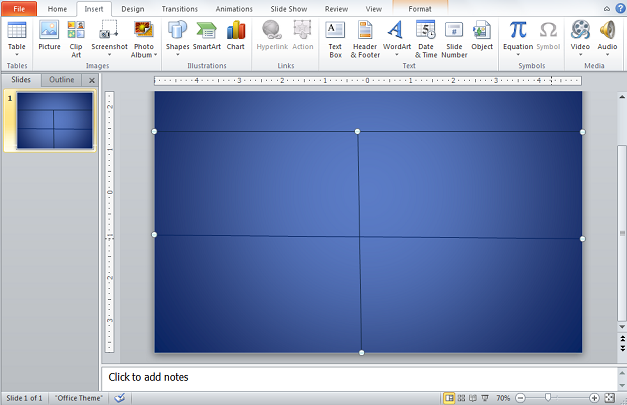
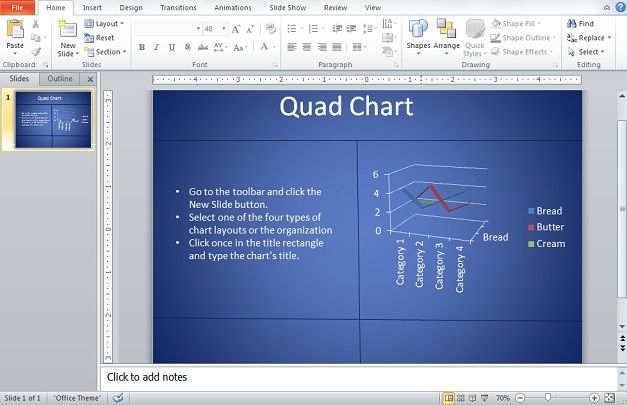
A basic quad chart has been made. You can insert your created graphs, imagines, bullet points, in it now. Put all the contents you want in this slide. You can put anything you would like in the quadrants but there is issue of resizing your content to fit the quadrants.
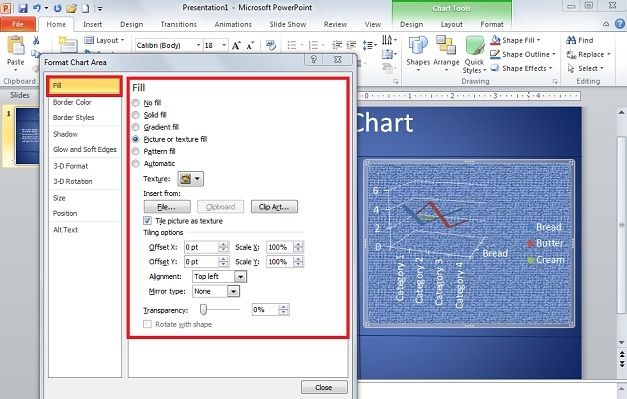
If there is one chart, you can even put its own background. Either before resizing the chart or after resizing it; right click on the outer border of the chart then select Format Chart Area.
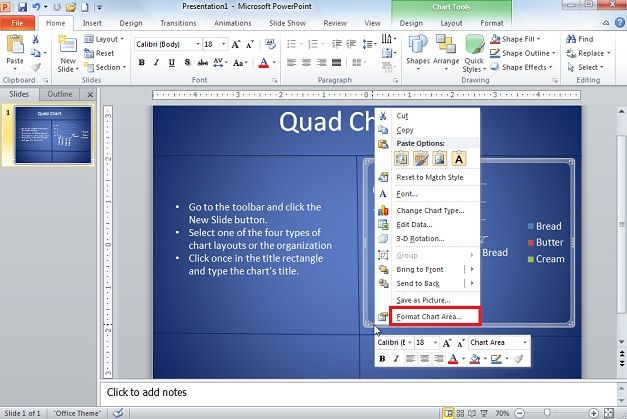
New windows Format Chart Area will appear on Fill by default, choose one of the fill options according to your requirements.
A particular part of quad chart in PowerPoint has its own background and style layout.
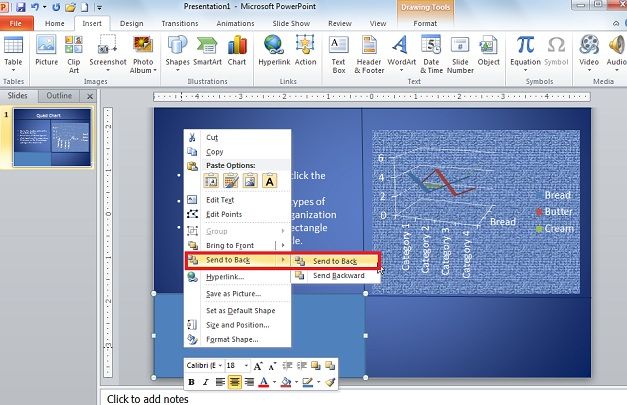
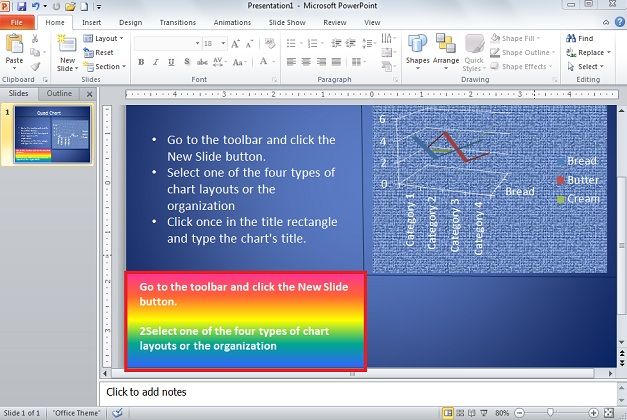
To save time on doing a background for content that is just text, click on the Insert tab and Shapes once again and select rectangle. Resize it to the shape of a quadrant and drag it in place. Right click on it and select Send to Back and then Send Backward.
Right click once again and select Format Shape at the bottom of the drop down list. Format Shape window will be open. From Fill options choose the color options for the selected Rectangular Area.
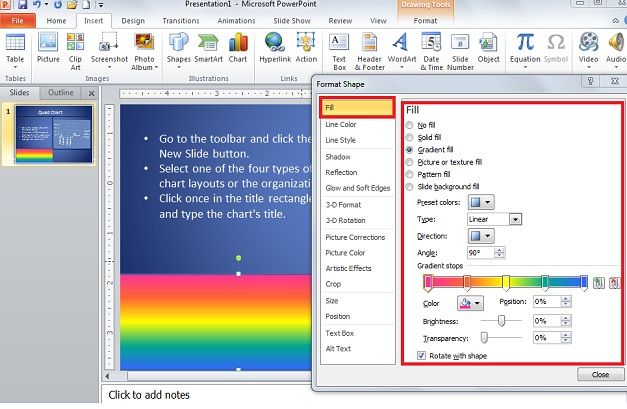
Place your text on top of the square which is now serving as that quadrant’s background.
You can put content in quad chart in PowerPoint presentation according to your needs are requirements. You can make quad chart layout in way you want to show your audience, there is no definitive format to follow for structure, theme, or design.
You can create quad chart once and save as a template for future use. The background can be edited as can the color and thickness of the lines that make quadrants for your PowerPoint quad chart.