Home ย  PowerPoint Tutorials

Merge Two Presentation Files in PowerPoint 2010

You can create an eye-catching presentation with two different power point presentation files, instantly merge them using built-in tools of MS PowerPoint. The end result will be a single seamless PowerPoint file with the slides from the second presentation integrated with your first presentation’s slides. Open the PowerPoint presentation into which you wish to merge […]
Create a Calendar in PowerPoint 2010 with Shapes and Tables

The Microsoft PowerPoint is certainly a best choice for creating and distributing slide shows, but do not discount the PowerPoint for other purposes. PowerPoint can help streamline some of your everyday tasks, like, keeping track of a schedule and ongoing appointments. Through itโ€™s in program templates, PowerPoint provides a way for users to customize calendars […]

Advertisement

Create Flow Chart using SmartArt in PowerPoint 2010

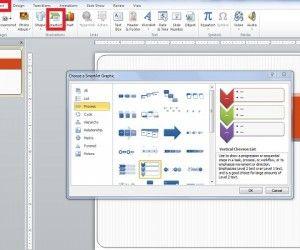
Flow charts help you demonstrate different processes that are occurring. They are an excellent guide to have when you need to demonstrate different decisions involved in a process. With the introduction of SmartArt in the Microsoft PowerPoint, anyone can create a flow chart. SmartArt gives you flow chart templates in which you can add your […]

Make a Bi-Fold Template in PowerPoint

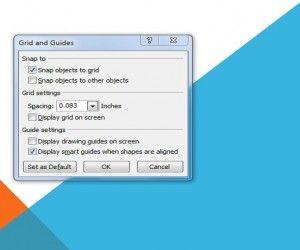
Bi-Fold PowerPoint Templatesย are used to design a flyer, catalog, and purposes as well.ย To prepare the bi-fold design for a PowerPoint template, the best way to do it is accessing the Master View. Delete any placeholders on the slide, such as text boxes, by clicking on them to select them and pressing Delete. Microsoft added new […]

Insert Simple Horizontal Line in PowerPoint 2010

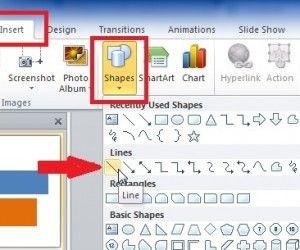
Microsoft Office PowerPoint 2010 provides a Line button so that users can draw straight lines on slides. With PowerPoint 2010 open slide, choose a location for horizontal line, Click Shapes from Insert Tab the icon of buttons looks a straight line. This tool bar has many drawing that you can insertย in your PowerPoint. For example […]

Create Statistical Control Chart in PowerPoint 2010

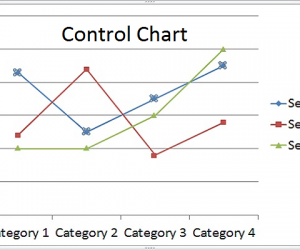
Control chart in PowerPoint is a tool used for SPC (statistical process control) in manufacturing operations. The chart graphically shows process steadiness by plotting the occurrence of defined events or particular values or measurements. Upper and lower control limits are made evident to display when plotted data for an event or value falls outside the […]

Advertisement