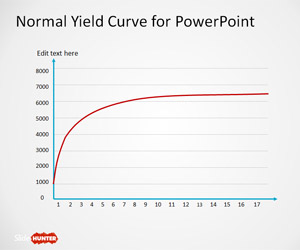
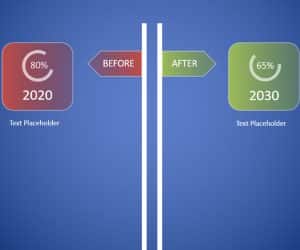
Free Normal Yield Curve PowerPoint Template or yield curve is a line that plots the interest rates and you can use it in Microsoft PowerPoint presentations.
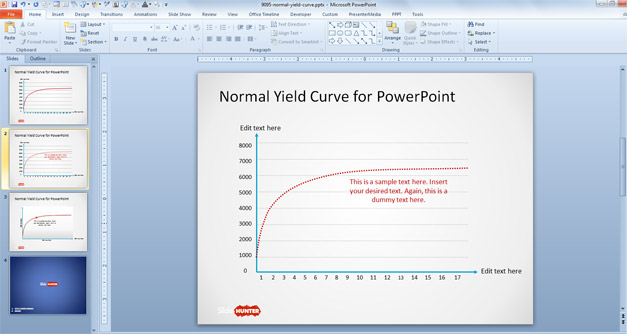
You can use this yield curve to plot the interest rates at a set point in time of bonds with equal credit quality but different maturity dates.
There are different yield curve designs but the most popular ones are the yield curve that compares the 3-month, 2-year, 5-year and 30-year U.S. Treasury debt. The yield curve is used as a benchmark for other debt in the market. For example it is also used to compare the mortgage rates or bank lending rates as well as predicting changes in economic output and growth.
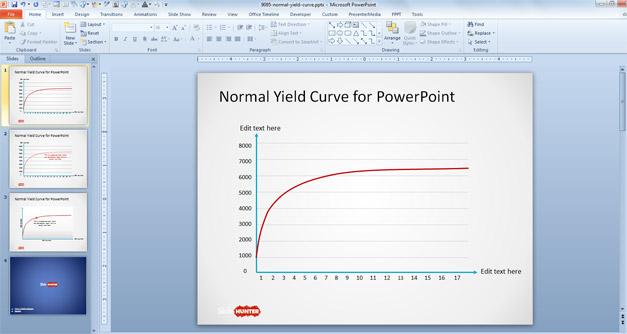
Inside this free yield curve design for PowerPoint you can find useful Yield Curve illustrations created with shapes. The editable shapes for PowerPoint help you to make financial presentations including yield curves. You can copy and paste the yield curve into your own presentation slides.
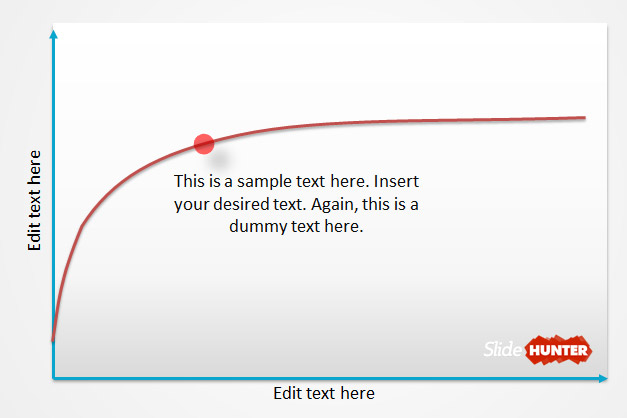
The three slides inside this presentation template contains different yield curve designs. The 3rd. slide design also has a marker which let you easily highlight any desired point in the curve. You can easily move the marker to any desired location in the plot curve.
Alternatively you can download other free curve shapes for PowerPoint and charts including this free J-shaped diagram for PowerPoint.
License: cc by 2.0
Related Presentation Templates
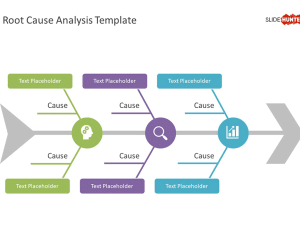
Free Root Cause Analysis Template for PowerPoint
A three-tier structured Root Cause Analysis slide template for PowerPoint presentations, with fishbone diagram, enables in-depth root-cause analysis with visual impact.
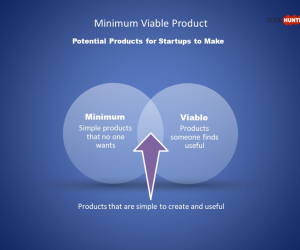
Free MVP PowerPoint Template
Free slide template for Minimum Viable Product presentations, with 100% editable placeholders.
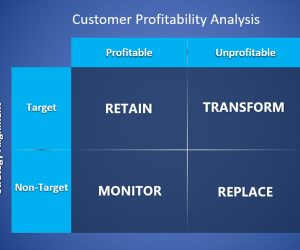
Free Customer Profitability Analysis PowerPoint Template
Download free CPA template with a matrix containing Reatain, Transform, Monitor and Replace components.
Free Before & After PowerPoint Template
Download a Before and After slide template for PowerPoint presentations, to compare a past situation with a future situation.
