If you need to prepare presentations for stock market or any financial PowerPoint presentation then the popular candlestick charts can be used to represent the historical data for any quote or ticker that you choose. Here we will show you how to create a simple but useful candlestick chart in PowerPoint 2010 by using Excel first.
You can download the historical prices from sites like Yahoo Finance. For example, let’s say that we want to get the data for Microsoft (MSFT) with the historical prices. Then we can go to http://finance.yahoo.com/ and look for MSFT ticker to get the quote.
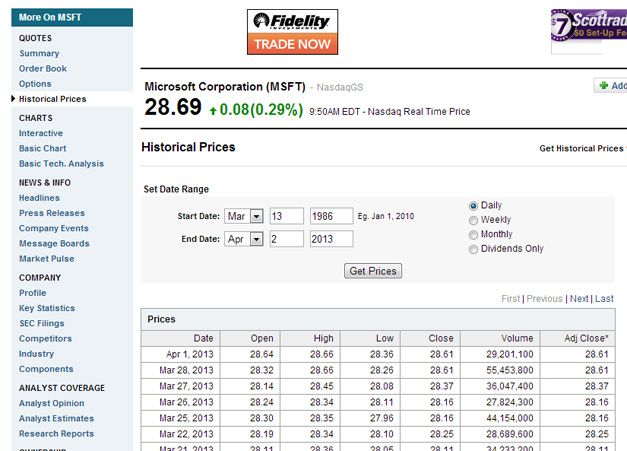
Now, scroll down until finding the download link and click Download to Spreadsheet.
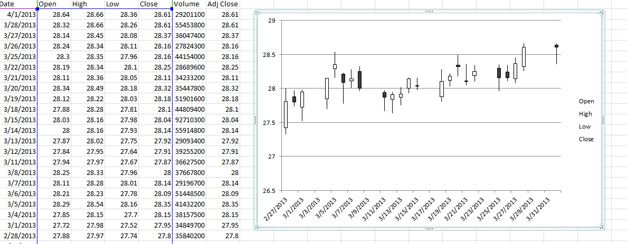
Now you can open the tables.csv in Excel and you will see something like the following picture.
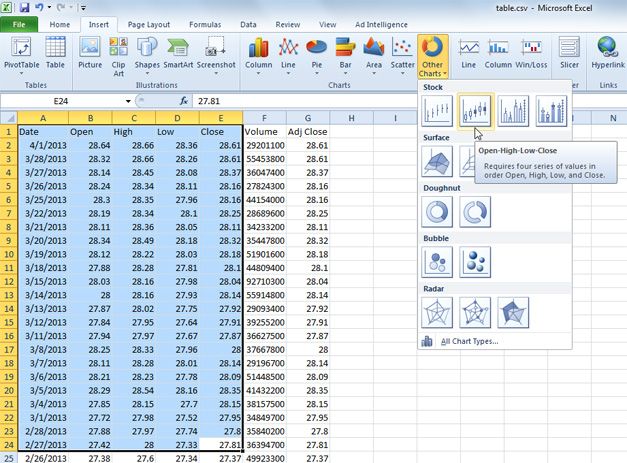
Select the range of data that you want to include in the stock market analysis presentation and then click Insert and look for Other Charts under Charts section. Use the Open-High-Low-Close chart to insert the candlestick chart in Excel 2010. Notice that the volume and adj. close won’t be used in this case.
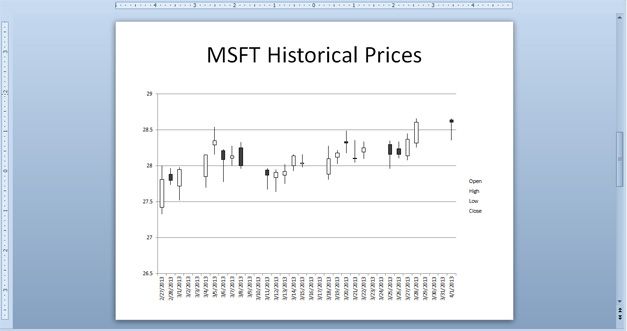
Finally, copy the resulting chart into your PowerPoint presentation and then you can adjust the styles and chart properties to prepare your finance PowerPoint presentation.
If you need to download free finance PowerPoint templates and backgrounds to make awesome and stunning PowerPoint presentations then you can download free finance diagrams and templates for Microsoft PowerPoint 2010 and 2013 from SlideHunter.com