Free Before & After PowerPoint Template
Download a Before and After slide template for PowerPoint presentations, to compare a past situation with a future situation.
Download free comparison templates and slide designs. The comparison PPT templates include PowerPoint templates with 2 columns and 3 columns as well as original comparison charts for PowerPoint presentations. Comparison slides can be used along presentations to compare different concepts. For example, while comparing different services or providers, or even products.
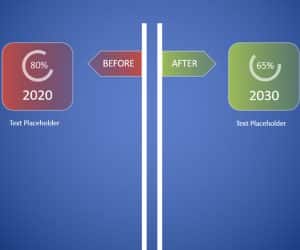
Download a Before and After slide template for PowerPoint presentations, to compare a past situation with a future situation.
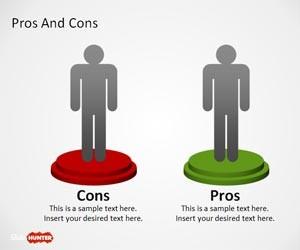
Download 100% free pros & cons presentation template and slide design for PowerPoint & Google Slides.
Visually communicate the advantages and disadvantages of a particular topic, decision, product, or idea with this pros & cons slide template.
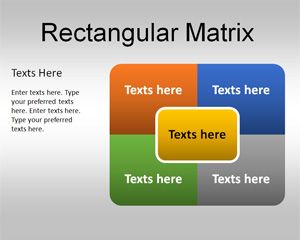
Simple matrix PPT template design with four quadrants and a shape in the center to present a central topic.
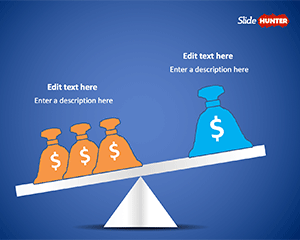
Free balance scale presentation template with money bag illustrations for making comparison slides in PowerPoint & Google Slides.
Comparison slides in PowerPoint can help to show a comparison between different products and services to an audience. Comparison slides are often being used to compare different alternatives, regardless of the industry and presentation purpose. For example, a SaaS solution or business presentation and pitch deck on a SaaS product can include a comparison slide to compare the different plans available in the Plans & Pricing page. Alternatively, a presentation on an Investment plan can use a comparison slide to compare different investment strategies and options and help the audience to choose between them.
A comparison diagram is a type of diagram that helps to compare different concepts easily. It can be a 1-1 comparison, which will help to compare one item versus another one, or it can be a multi comparison slide where more than 2 concepts, elements or ideas are being compared.
A comparison chart in PowerPoint can be created in multiple ways, for example using PowerPoint shapes or even tables. Often, comparison charts are visually represented in different columns with titles at the top of the chart (where the Product X or Service X is being displayed) and then listing each of the features one by one.
One of the most basic examples of comparison can be found in online services and SaaS products when comparing different plans available. E-commerce websites and review sites also provide comparisons between different products, listing each of the features available on each product plus the price.
Comparison charts can be found in different flavors and design variants. For example, some presenters may opt to use a comparison table slide listing products or services in different columns, while in other situations a more visual comparison representation is being used.
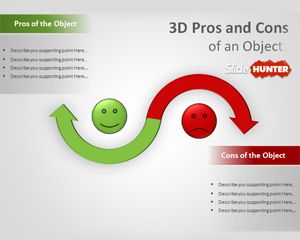
Comparison slides can also be used to represent Pros & Cons, Benefits & Drawbacks, Good vs Bad, Winner vs Loser, etc.