Gap analysis chart is also known as a spider gap chart, spider chart, and radar chart in PowerPoint. Creating a gap analysis document includes determining the desired skill levels in the required areas. Selected skills depend on the needs of the particular company, person or group requiring the analysis document. Skill areas may include general categories such as responsibilities, duties, tasks, functions and knowledge. A comparison between the current and the required skills and competencies provide the basis from which the skill gap is calculated. Recommendations provide insights into required actions for bridging the gap.
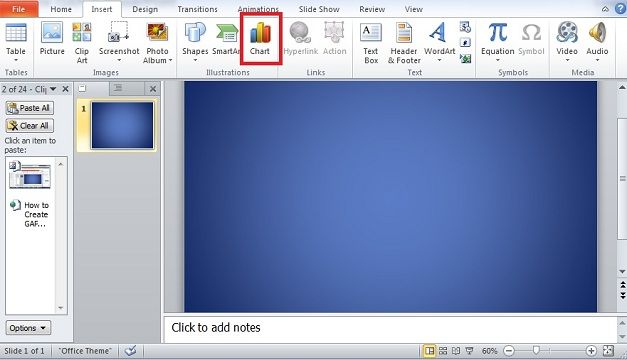
To create gap chart in PowerPoint, click Insert tab and click on Chart.
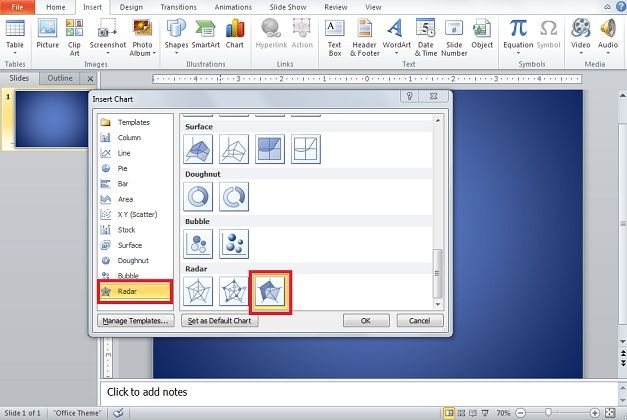
Once Chart menu is opened, select Radar. Either of radar chart type would work for this first example, but I choose Shaded Radar. It is easy to change it later and it will be changed to show the different types.
Enter you data for gap chart analysis in Excel—which opens whenever you insert a chart into PowerPoint and is linked to your chart.
An excel file will be open automatically containing data for the chart, change data in that file and chart in PowerPoint change accordingly.
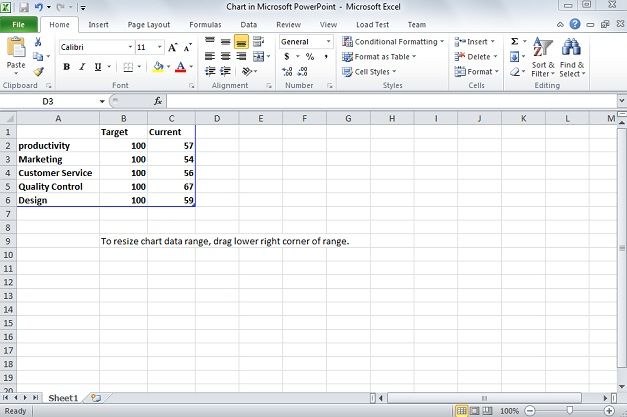
In this example, shaded radar chart, one column is target and second column is current. This means target in the B column and current in C column. The end target for any type of growth is usually 100 — set your goal to achieve.
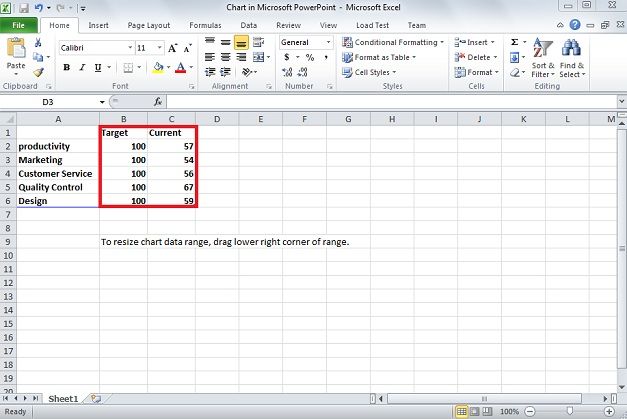
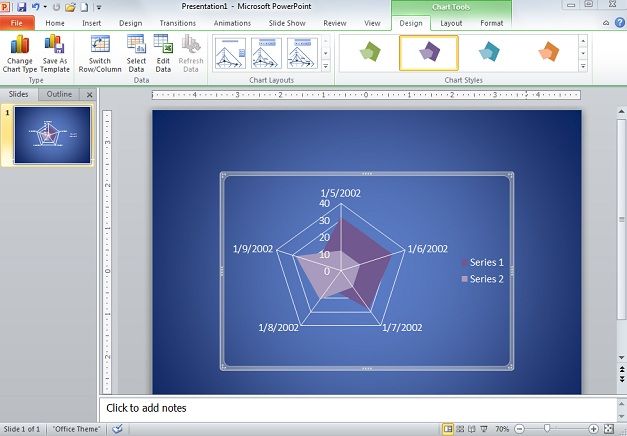
The reason for putting the two options in this order is that current will show on top in the shaded radar chart. This would not matter with the other two gap analysis chart types. After you have inserted the compiled data into Excel your chart is complete. Make change in design and style as you like.
If you want to change the Chart Type, click on the spider gap chart so that Chart Tools appears once again at the top of the screen. There will be a green tint over the Design, Layout, and Format tabs, click on Design.
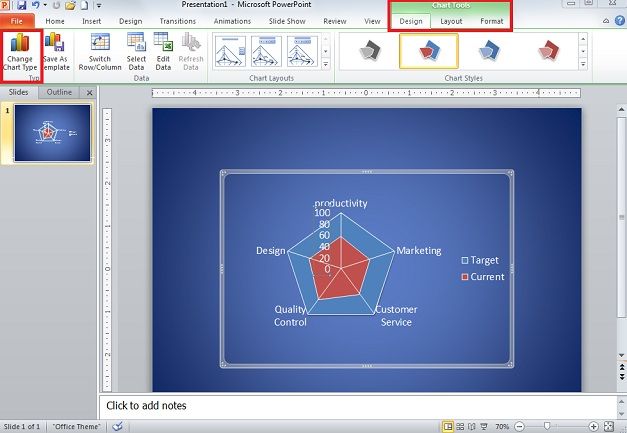
Navigate to Change Chart Type, select Radar, and select any of two other than Shaded Radar. I choose radar type.
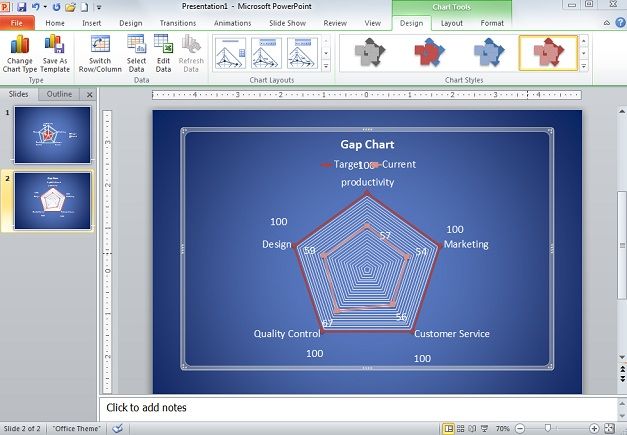
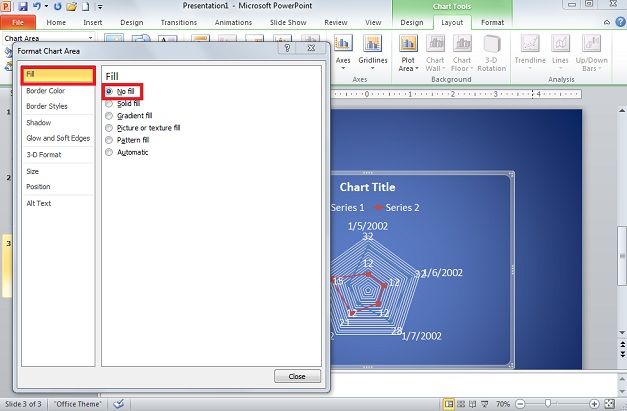
Chart Layouts allow change in appearance of the spider chart. With the shaded radar chart, if you want to show the overall chart and have current shaded, select Layout. Go to the upper left of the window below File, choose Target in the drop down and click Format Selection.
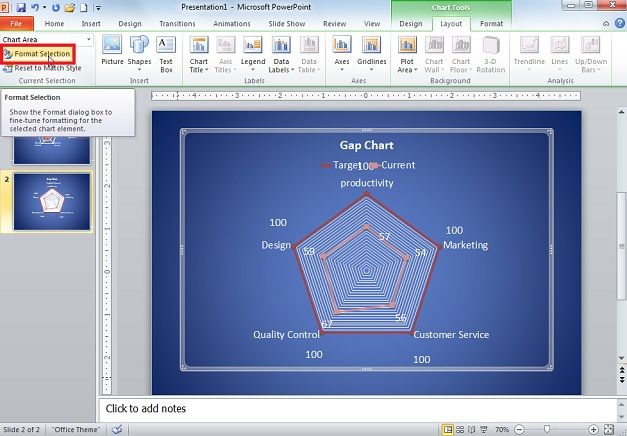
Go to Format Chart Area and from Marker Fill select none. Now the rest of the spider chart is shown and just the current data is shown to be shaded.
The gap analysis is not always the best approach in determining the changes you need to make in your business practices. The resulting strategies tend to be stationary in approach and the vision and goals of your business can evolve, requiring repeated gap analyses.