Microsoft PowerPoint is a simple to use presentation program that makes it easy to create many different kinds of charts, graphs and other graphics for easy viewing. PowerPoint 2010 has a set of tools that make creating a flowchart for a presentation a matter of point and click. Making a flowchart diagram in PowerPoint 2010 can be a quick task to do especially if you have data or a bullet point list ready for the progression of your flowchart as well as a map of how you want the flowchart to go.
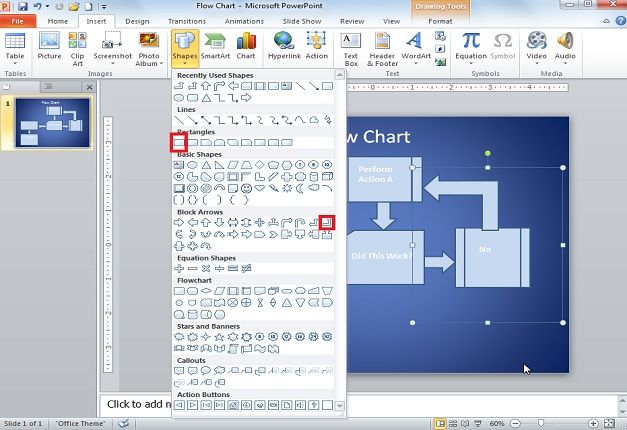
Open in PowerPoint slide and click Insert tab and Shapes or select Shapes from the Home tab.
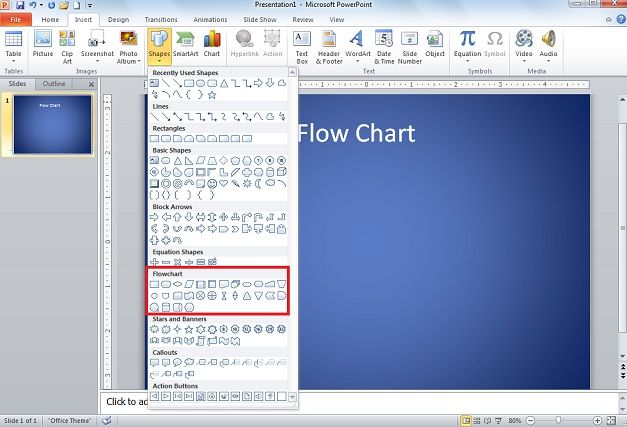
Select Flowchart of your choice from list, but other shape groups that can be used to the same effect include: Rectangles, Block Arrows, Basic Shapes, and some of the Banners. These shapes groups provide enough space for a text box as well as points for a line to latch on to. In the case of Block Arrows no lines are needed.
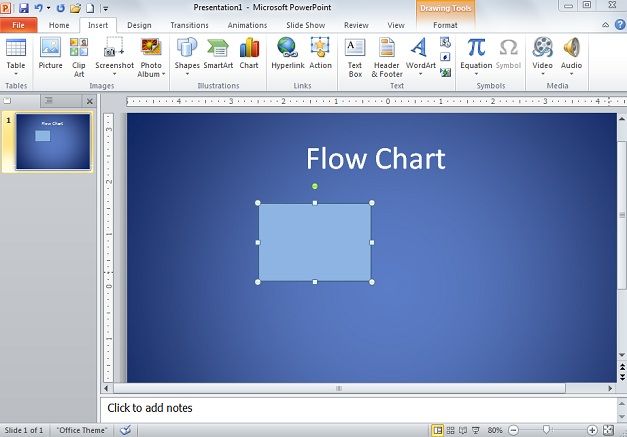
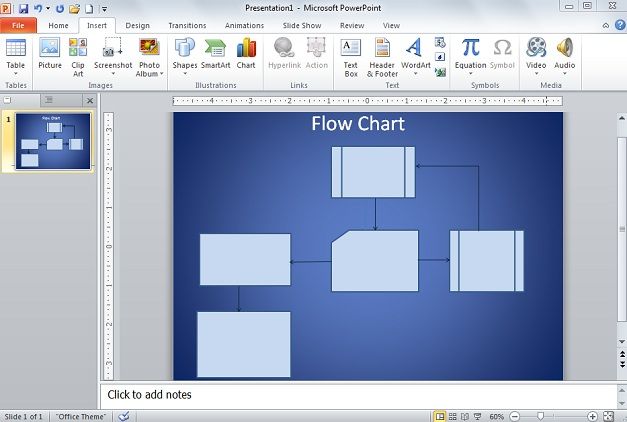
Structure the rest of our flowchart diagram, there is no defined setup to use; just what you like will work for your presentation and data. Simply drag the flowchart shape to the size you want and repeat the process for the number of shapes according to your requirements.
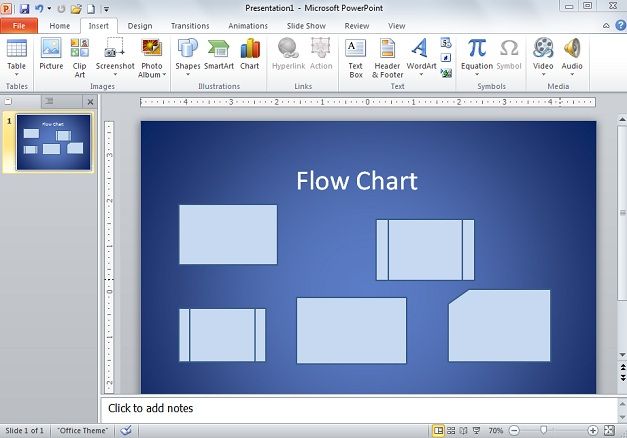
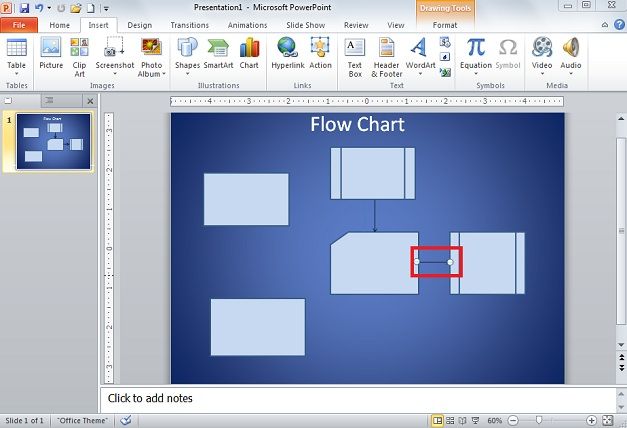
Arrange shapes in your required order. Go to Shapes and select Lines. On moving cursor over the shapes in the slide, PowerPoint will show the attaching points in red. Use lines you feel will work best for your chart.
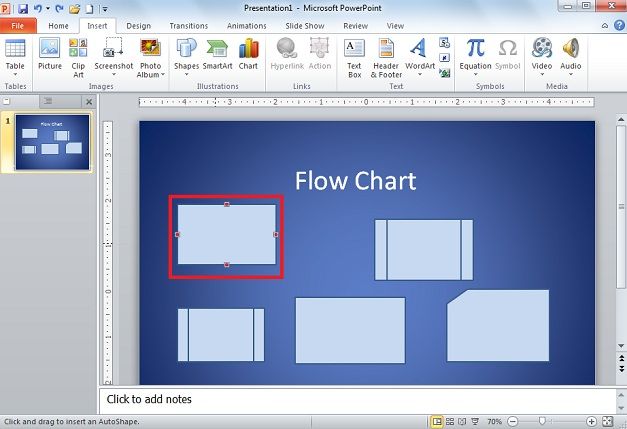
Connect and adjust boxes of your flowchart according to what you want to express.
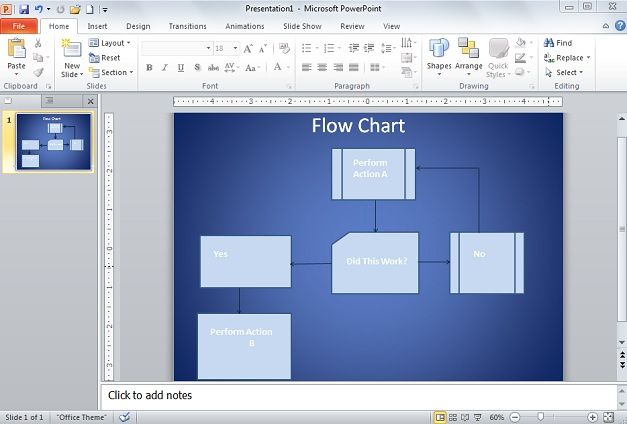
Once flow chart in PowerPoint is structured, click on Insert and Text Box. Drag the text box over the flowchart box and input the data.
When flowchart is complete, all steps, data, etc. should be shown in the order you have plotted out.
Some shapes don’t require lines, using Block Arrows under Shapes; get rectangles with arrows attached.
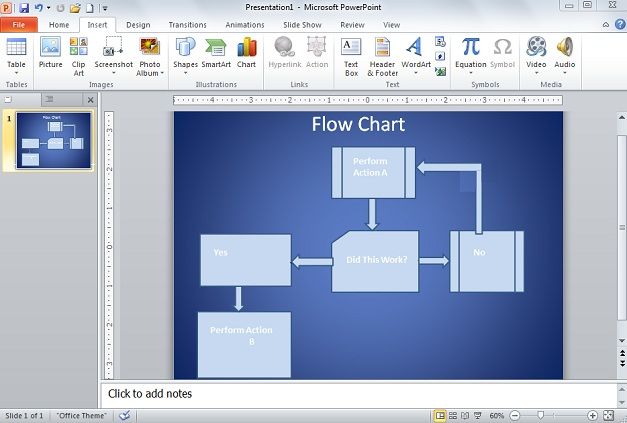
By using some shapes and grouping them with other shapes you can create the more complex boxes required for your flowchart diagram.
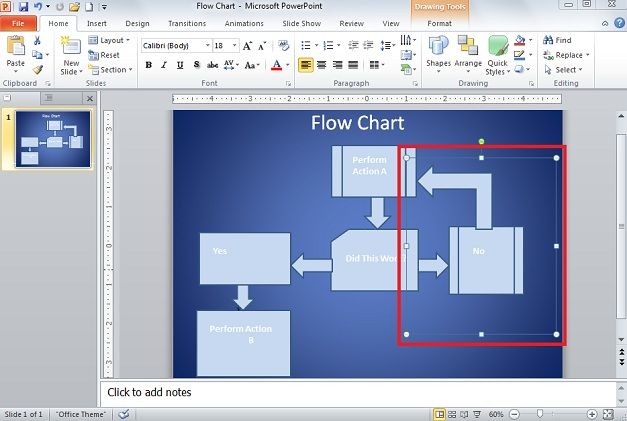
In above focused figure, a combination of a Rectangle and a Block Arrow shape are used.
Once the chart is complete, go through the flow chart and add a design and edit its different features to fit in your requirements. With flow charts in PowerPoint 2010, you can make complex and appealing flowcharts to express your plans and data.