There are multiple ways to create cause and effect diagrams for presentations but if you want to boost your productivity and save time and money then you can read this article and learn how to use our free PowerPoint templates and diagram templates in your own presentations.
Cause and Effect diagram offer analysis tool to provide systematic way of understanding effects and the causes that create those effect. You can use the cause and effect diagrams widely for different presentation purposes and analysis, for example you may want to download and use the cause and effect diagrams to make a Root Cause Analysis? presentation using Microsoft PowerPoint.
Cause and effect diagrams are also known as Ishikawa diagrams or Fishbone diagrams because the fish bone diagram looks like the skeleton of a fish. Even if you can create complex fishbone diagrams using tools like SmartDraw, you can also take advantage of PowerPoint SmartArt and shapes features to create simple but useful diagrams for your presentations.
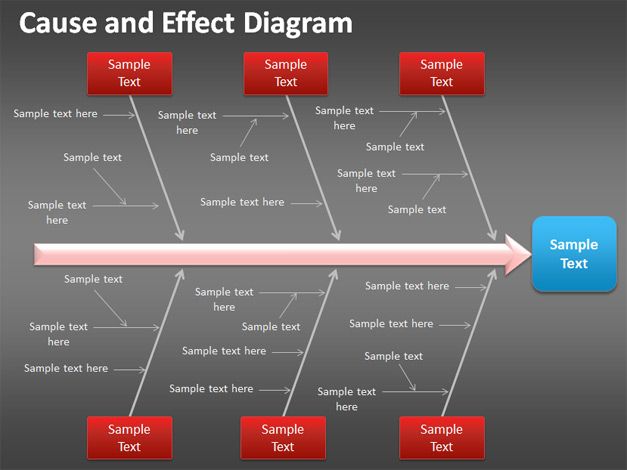
Simple Cause and Effect Diagram with Dark Background
Alternatively you can download other causal diagrams for PowerPoint including Herringbone diagrams, Fishikawa diagrams or simple cause and effect diagrams like this Fishbone template for PowerPoint.
Light Fishbone Diagram for PowerPoint Presentations
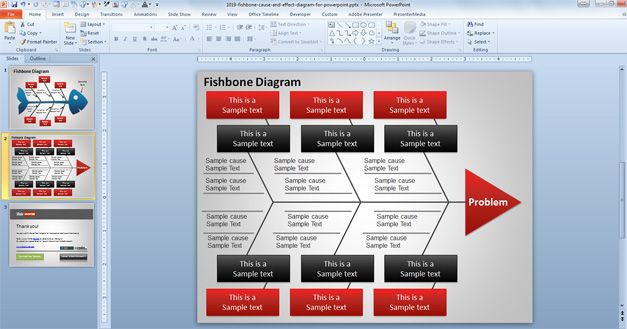
This variant of cause and effect diagram uses a light background and rectangular shapes with red and black background color to describe the tasks and important concepts. The diagram is connected with dark arrows and lines created with line shape in PowerPoint and then ends with a simple triangle shape in PowerPoint to describe the problem.
You can download the free cause and effect diagram for PowerPoint presentations and copy and paste them into your own business slides, for example to make presentations on strategy as well as trying to identify causes of a given problem.
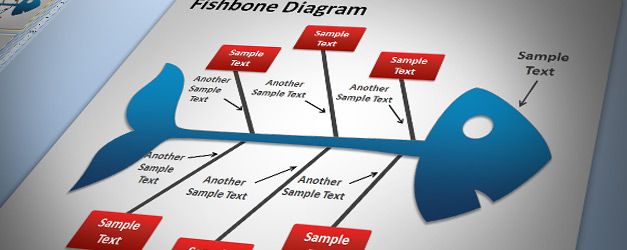
Here is another example of cause and effect diagram that you can create using our free tempaltes (download cause and effect template from here). In this example, you can see a fish illustration where the head of the fish represents the problem and then the fishbone contains the primary and secondary causes with descriptions. This is not an animated fishbone template but it is an editable Cause and Effect template that you can download to make root analysis PPT presentations.
Free Fishbone Diagram Template for PowerPoint
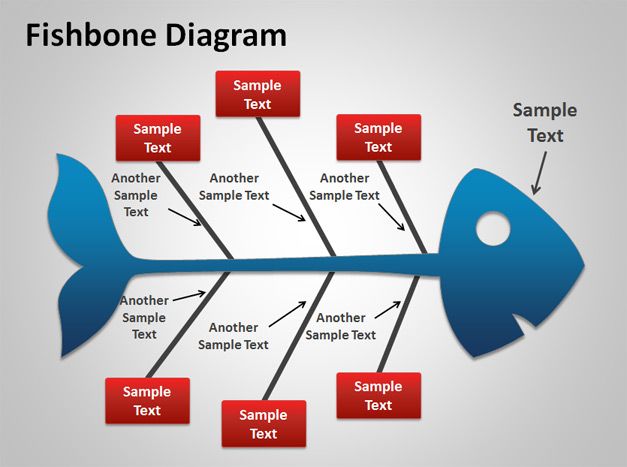
Normally in this kind of diagrams you will find the cause of a problem on the left, and then on the right you will describe the problem itself. Depending on the complexity of your problem, you may identify Primary Causes and Secondary Causes. The Primary Causes are the first level of lines while the second level of lines correspond to the Secondary Causes.
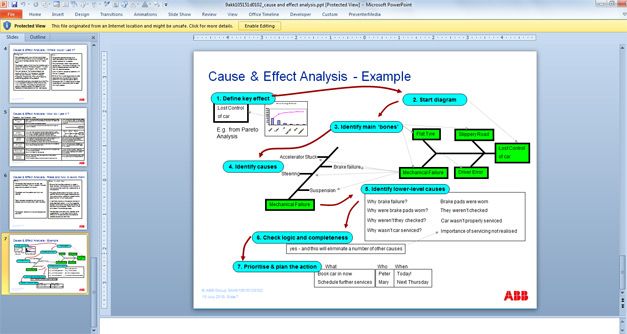
Example of real Cause & Effect Analysis in a PowerPoint Presentation
You can get some ideas from other presentations around the internet, like this Cause & Effect Analysis PowerPoint presentation that was published by ABB time ago. You can download this Cause and Effect analysis PPT presentation to understand how the cause and effect analysis are used in a real presentation.
You can use cause and effect diagrams to:
- To define a problem.
- To identify possible causes.
- To reduce the probable causes to the possible causes.
If you want to create a cause and effect diagram from scratch then you can start defining the key effect of a problem and then start drawing the diagram. Start drawing the diagram and brainstorm what could be the causes for each bone. Then add lower level causes of identified causes. Now it is time to check the logical validity of each cause/effect chain and check for completeness. You can prioritise the causes to address and plan the next actions.
This is a simple cause and effect diagram for PowerPoint presentations with a dark background color and fishbone design.